Fig. 10
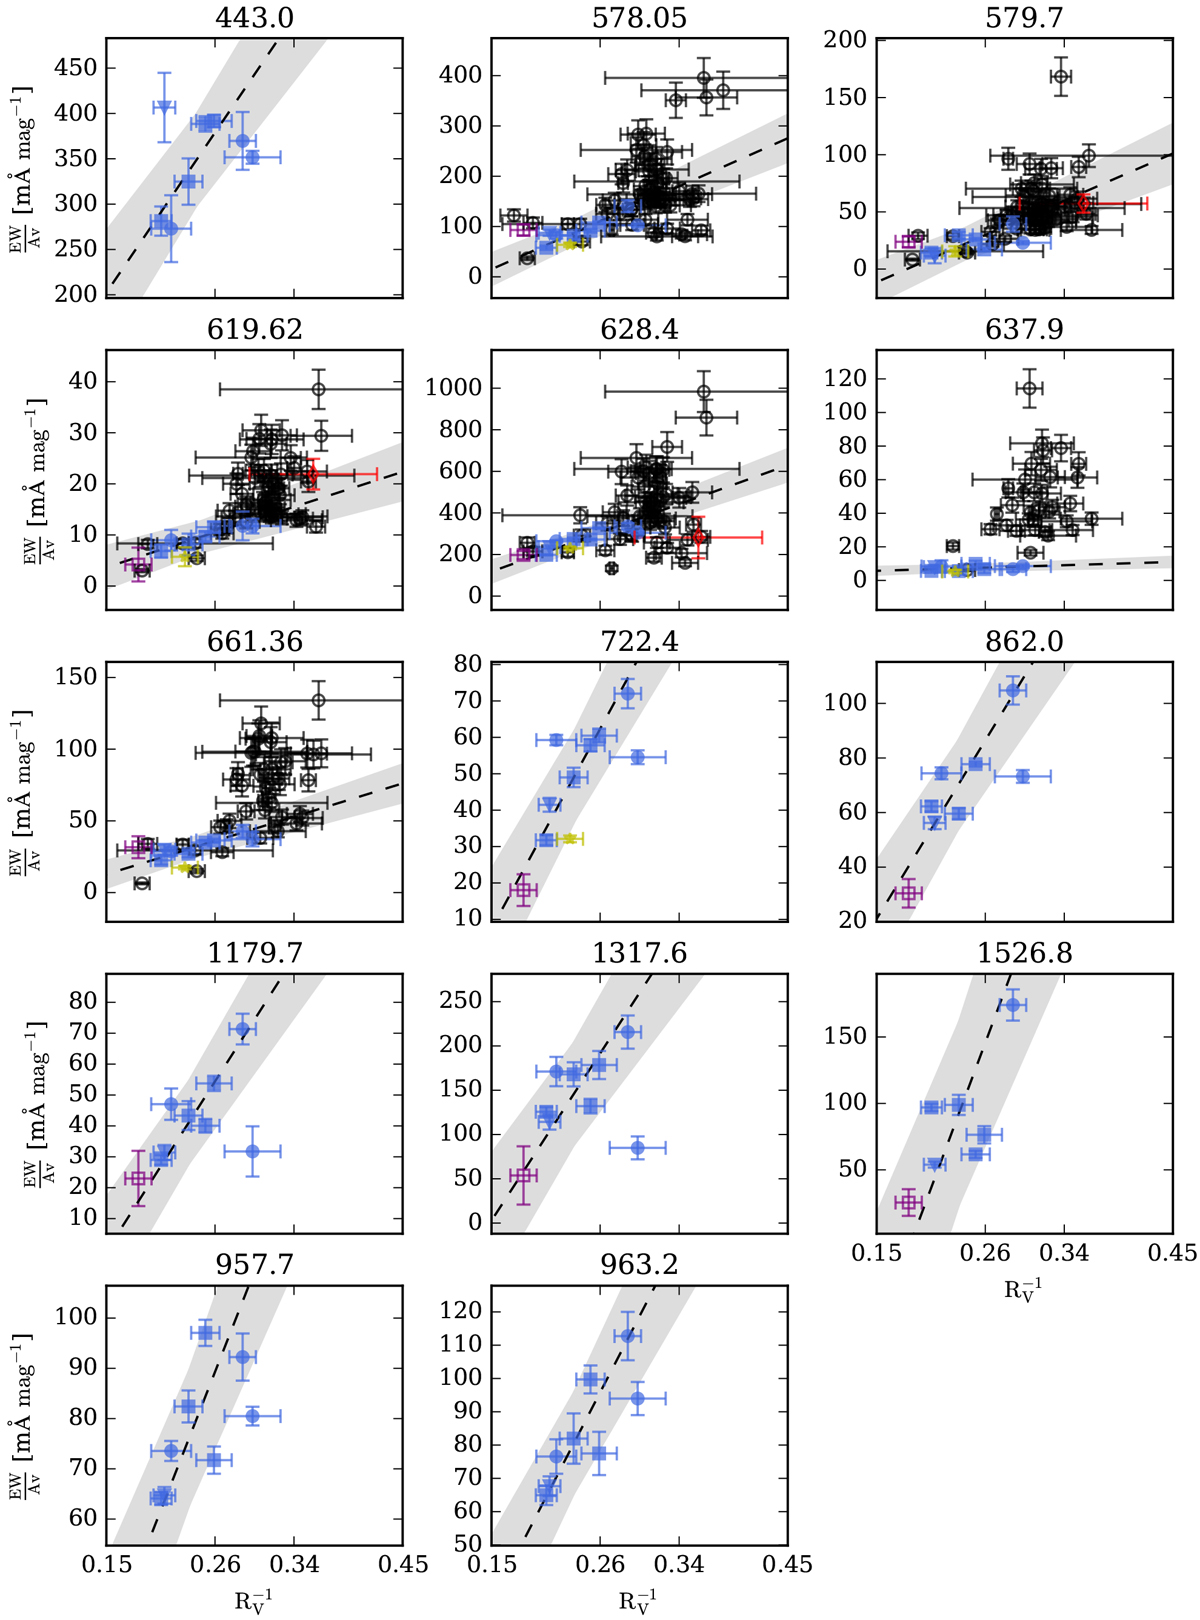
Normalised DIB EW vs. ![]() . The blue symbols show the M17 data; the dots show the stars in M17 with circumstellar disks, the triangles the stars with an IR excess longwards of 3 μm, and the squares the OB stars in M17. The open symbols show data from the literature. The purple square shows the position of Herschel 36, the yellow star shows the source 408 in RCW 36, and the red diamond shows the high mass X-ray binary 4U1907+09. The grey dots show the data by Xiang et al. (2017) when available. The black line shows a linear fit with
. The blue symbols show the M17 data; the dots show the stars in M17 with circumstellar disks, the triangles the stars with an IR excess longwards of 3 μm, and the squares the OB stars in M17. The open symbols show data from the literature. The purple square shows the position of Herschel 36, the yellow star shows the source 408 in RCW 36, and the red diamond shows the high mass X-ray binary 4U1907+09. The grey dots show the data by Xiang et al. (2017) when available. The black line shows a linear fit with
![]() and the shaded region the 1σ error box of the fit to the M17 measurements only.
and the shaded region the 1σ error box of the fit to the M17 measurements only.
Current usage metrics show cumulative count of Article Views (full-text article views including HTML views, PDF and ePub downloads, according to the available data) and Abstracts Views on Vision4Press platform.
Data correspond to usage on the plateform after 2015. The current usage metrics is available 48-96 hours after online publication and is updated daily on week days.
Initial download of the metrics may take a while.