Fig. 3
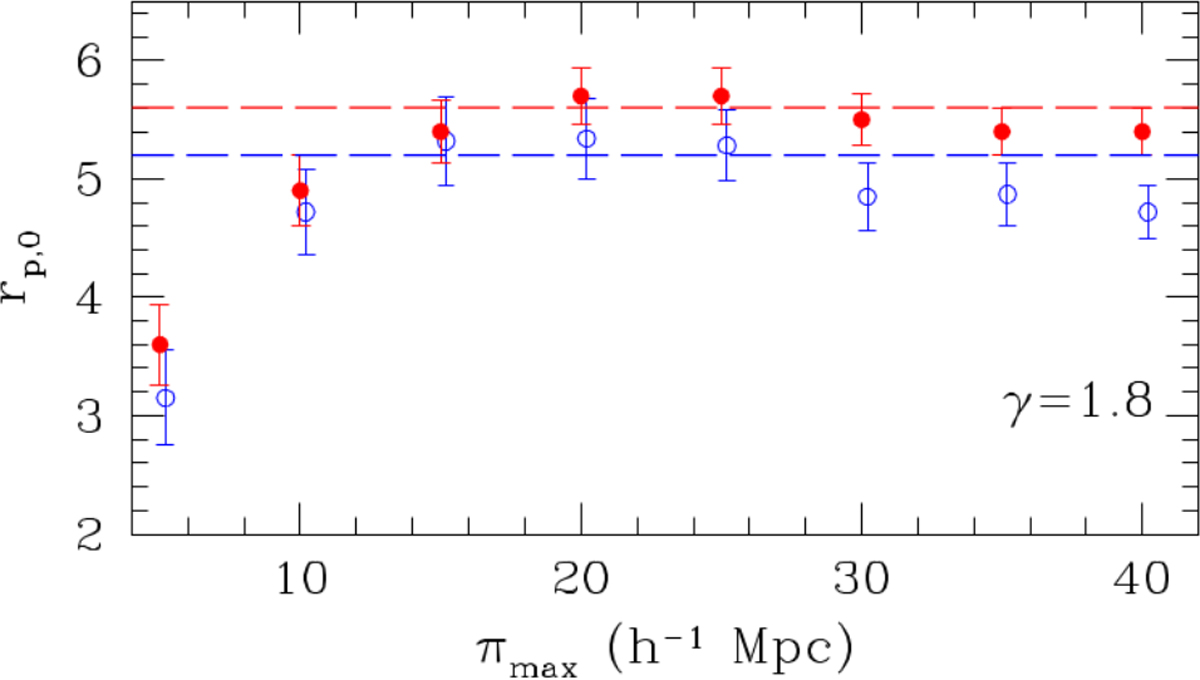
Dependence of the wp(rp) clustering length on the cut-off πmax value for the case of constant slope γ = 1.8. The red filled points correspond to the soft-band results, while the blue open points to the corresponding hard-band results. The red and blue dashed lines correspond to the estimated final rp,0 correlation lengths of the soft- and hard-band sources, respectively.
Current usage metrics show cumulative count of Article Views (full-text article views including HTML views, PDF and ePub downloads, according to the available data) and Abstracts Views on Vision4Press platform.
Data correspond to usage on the plateform after 2015. The current usage metrics is available 48-96 hours after online publication and is updated daily on week days.
Initial download of the metrics may take a while.