Free Access
Fig. 1
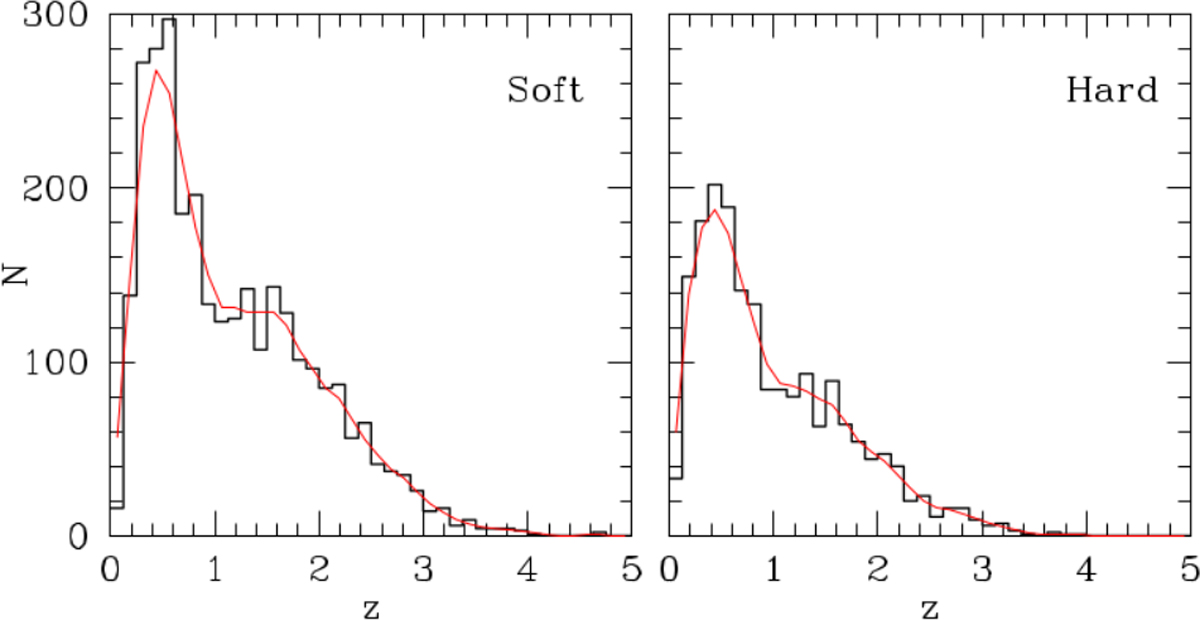
Redshift distribution of the soft and hard XXL-S AGN samples. The red curve corresponds to the mean over 100 random realizations according to the prescription described in Gilli et al. (2005) and using a Gaussian with a smoothing length of σz = 0.125.
Current usage metrics show cumulative count of Article Views (full-text article views including HTML views, PDF and ePub downloads, according to the available data) and Abstracts Views on Vision4Press platform.
Data correspond to usage on the plateform after 2015. The current usage metrics is available 48-96 hours after online publication and is updated daily on week days.
Initial download of the metrics may take a while.