Fig. 2.
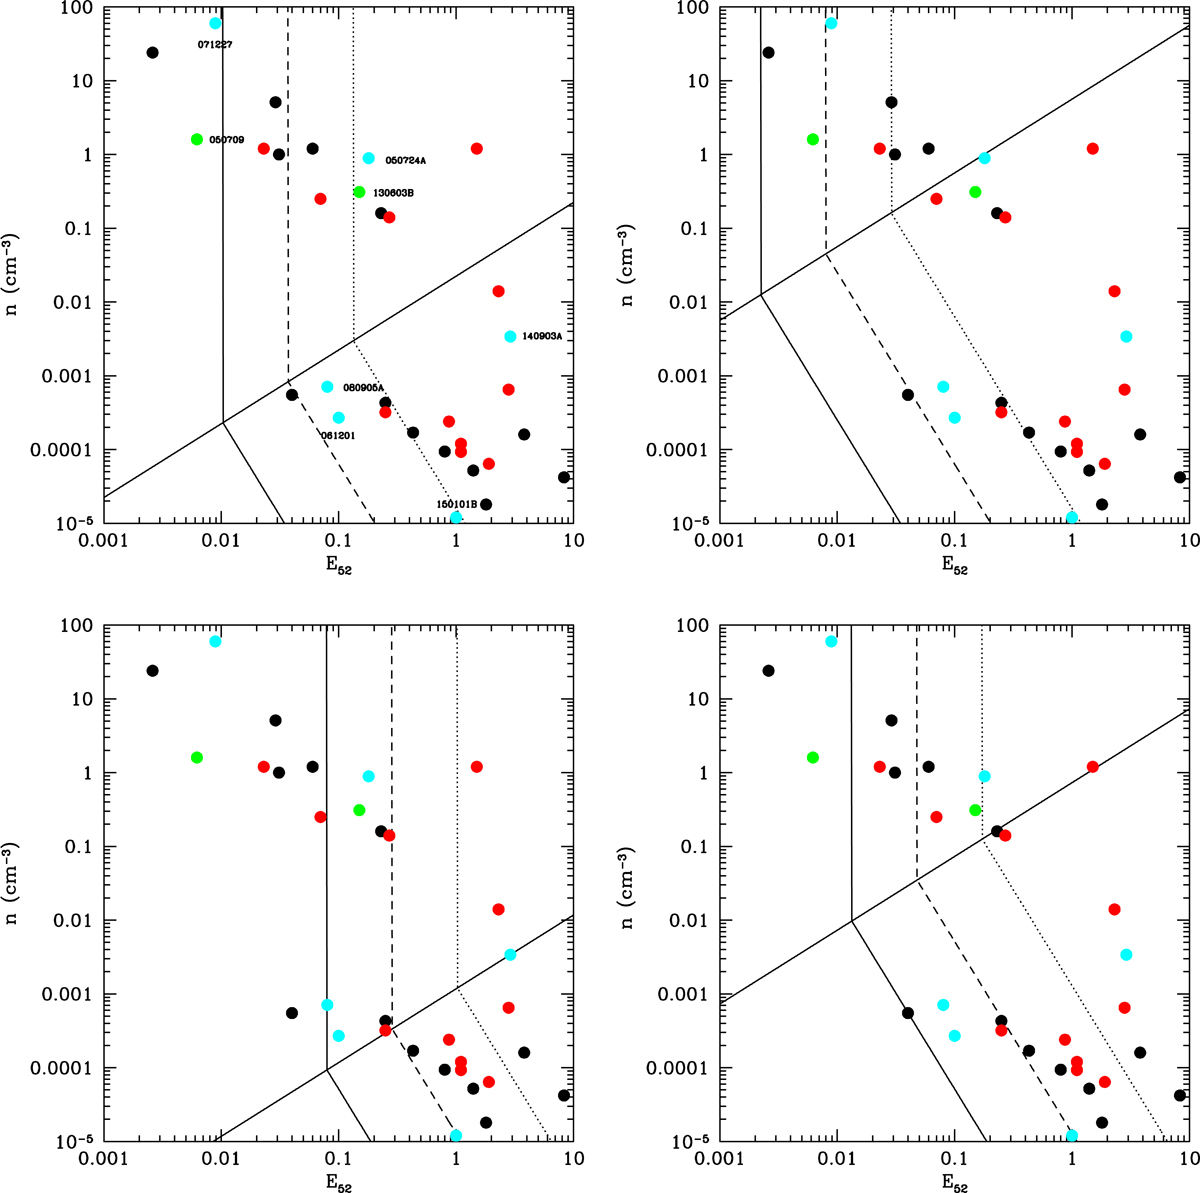
Kinetic energy-external medium density diagrams for short GRBs. The upper (lower) diagrams correspond to MKN = 10−2 (10−1) M⊙ while the left (right) ones correspond to a jet opening angle θj = 0.1 (0.2 rad). In each diagram the diagonal line represents events where the jet break takes place at the peak of the kilonova. The three lines that break when they cross this diagonal, limit the regions where the kilonova is brighter than the afterglow (on the left of the line). The full, dashed and dotted lines correspond to three values of ![]() : 10, 1 and 0.1. The dots represent GRBs in the sample studied by Fong et al. (2015), in green when a kilonova has been found, in blue (in red) when the measured redshift is below (above) z = 0.4, in black when the redshift is not known. In the first diagram, GRBs closer than z = 0.4 are identified.
: 10, 1 and 0.1. The dots represent GRBs in the sample studied by Fong et al. (2015), in green when a kilonova has been found, in blue (in red) when the measured redshift is below (above) z = 0.4, in black when the redshift is not known. In the first diagram, GRBs closer than z = 0.4 are identified.
Current usage metrics show cumulative count of Article Views (full-text article views including HTML views, PDF and ePub downloads, according to the available data) and Abstracts Views on Vision4Press platform.
Data correspond to usage on the plateform after 2015. The current usage metrics is available 48-96 hours after online publication and is updated daily on week days.
Initial download of the metrics may take a while.