Fig. 1.
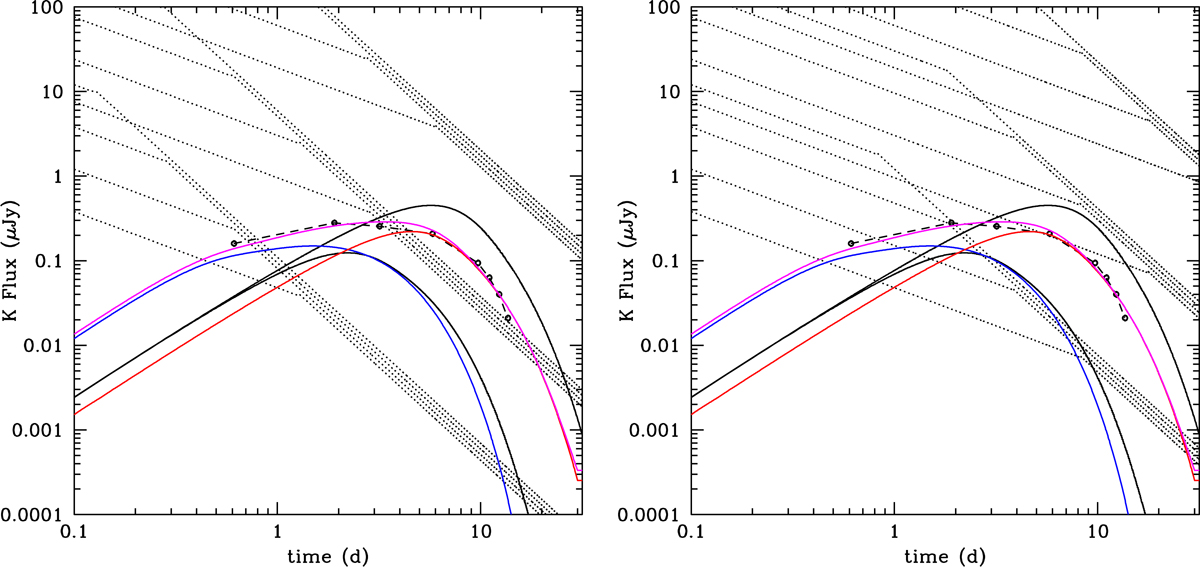
Kilonova and afterglow lightcurves in the K band for two jet opening angles 0.1 rad (left panel) and 0.2 rad (right panel). Three kilonova models are represented: two red ones (full black lines) assuming a uniform opacity κ = 10 cm2 g−1, an expansion velocity vexp = 0.2c and masses MKN = 0.01 (lower curve) and 0.1 M⊙ (upper curve) and a composite model, sum of a red (MKN = 0.04 M⊙, vexp = 0.15c, κ = 10 cm2 g−1) and a blue (MKN = 0.012 M⊙, vexp = 0.3c, κ = 0.5 cm2 g−1) component (purple, red and blue lines respectively). The dots connected by a dashed line correspond to the light curve of the kilonova associated with GW 170817 transported to a redshift z = 0.3. The three groups of dotted lines are afterglow light curves for an isotropic kinetic energy of 1050 (lower), 1051 (middle) and 1052 erg (upper group). In each group the four lines correspond to an increasing density of the external medium from 10−3 to 1 cm−3. The adopted values of the microphysics parameters are ϵe = 0.1 and ϵB = 10−3.
Current usage metrics show cumulative count of Article Views (full-text article views including HTML views, PDF and ePub downloads, according to the available data) and Abstracts Views on Vision4Press platform.
Data correspond to usage on the plateform after 2015. The current usage metrics is available 48-96 hours after online publication and is updated daily on week days.
Initial download of the metrics may take a while.