Fig. 8.
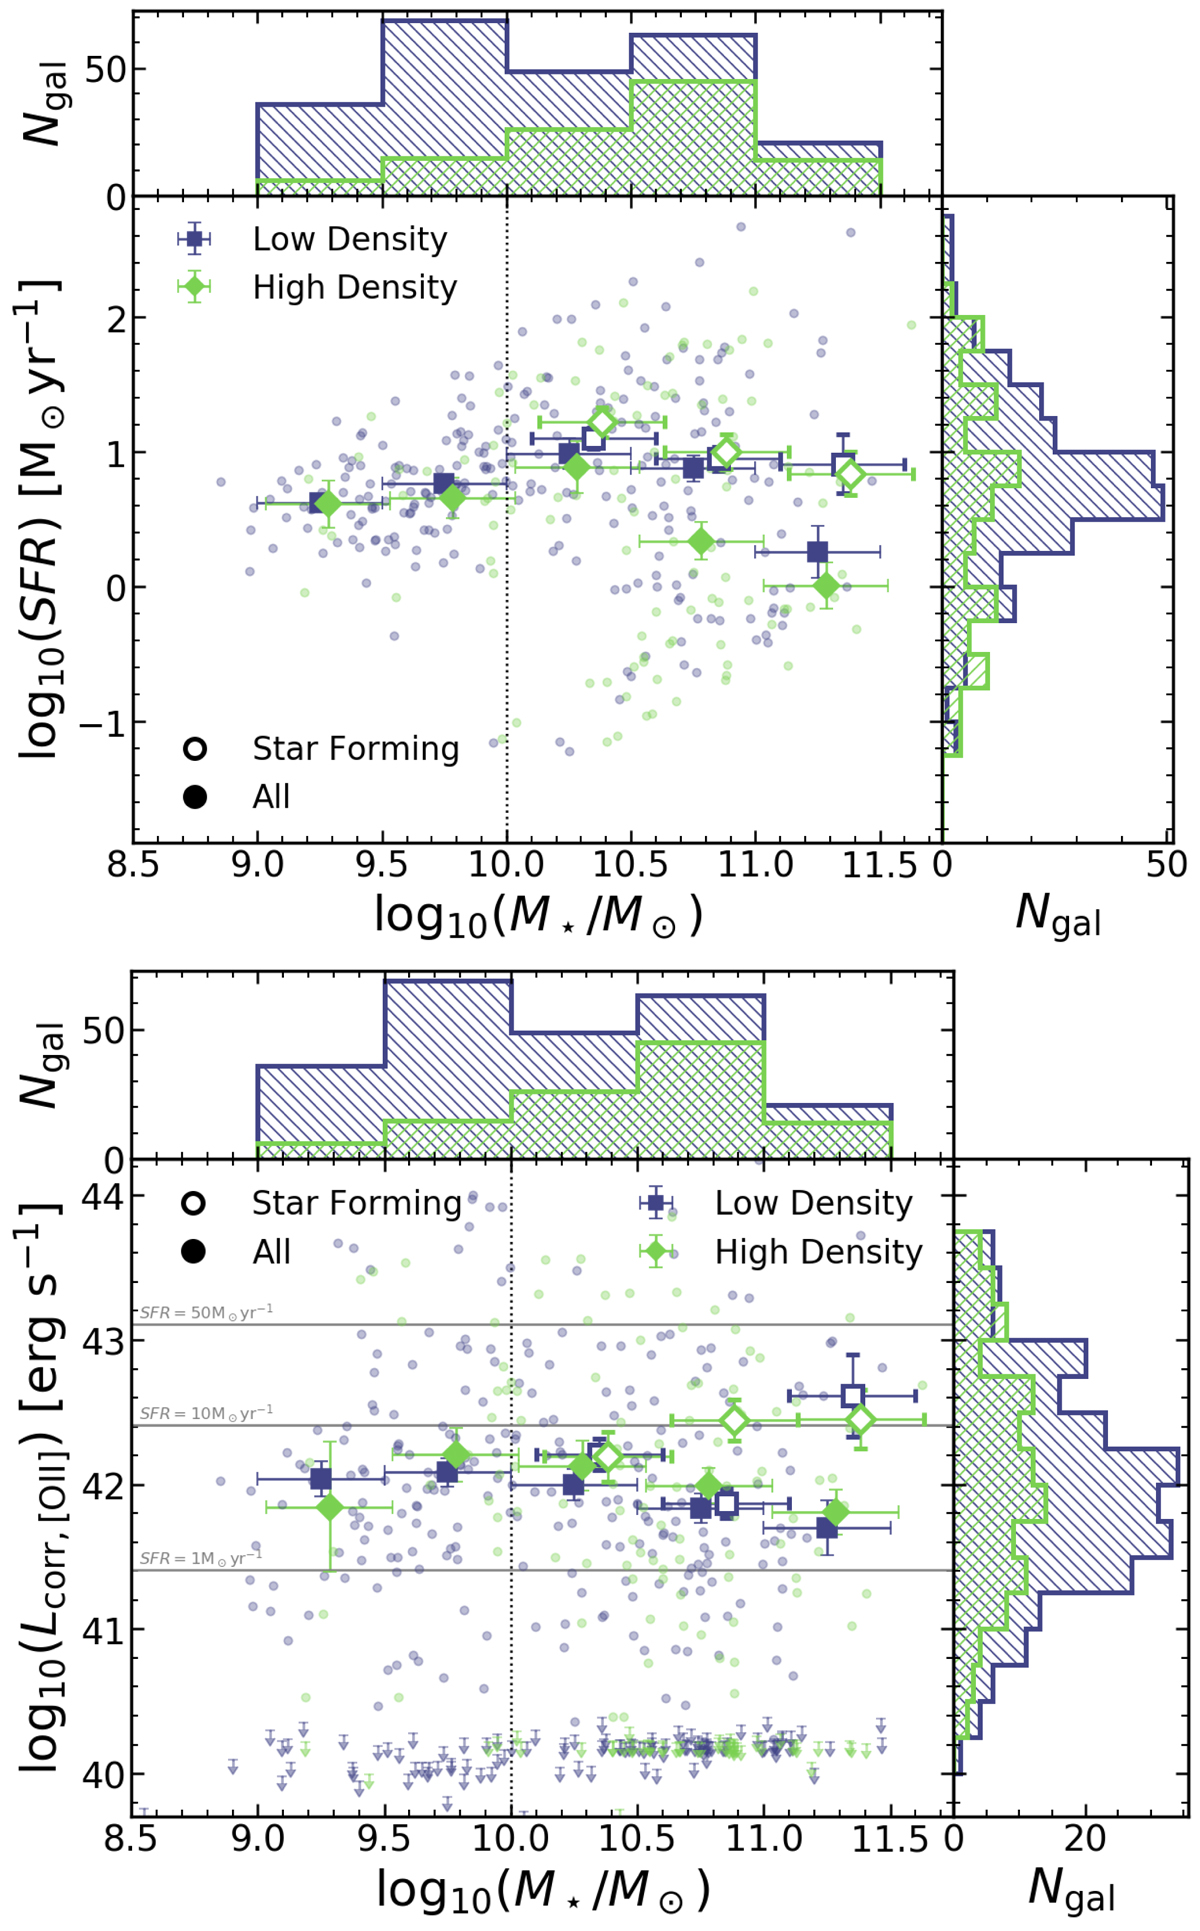
Top panel: SFR (from SED fitting) distribution as a function of stellar mass. Each small circle represents a single galaxy. Large squares show the median value for the population in stellar mass bins. Error bars show the error on the median of each bin. Higher-density regions are coloured in blue while lower- density galaxies are shown in green colours. The empty symbols represent the bins considering star-forming galaxies only, with log10(sSFR) > − 11. The symbols are horizontally shifted for visualisation purposes. The vertical dotted line shows the completeness limit of our survey. Globally, we find that galaxies in higher-density regions have lower SFRs, but only when considering the entire population. When selecting star-forming galaxies, we find no difference between the median SFRs in low- and high-density environments. Bottom panel: dust-corrected [O II] luminosity distribution as a function of stellar mass. We show as small arrows the upper limits on [OII] luminosity for the galaxies for which we have no measure with sufficient S/N. Horizontal lines show three values of SFR = 1, 10, 50 M⊙ yr−1 as derived from Eq. (3). We typically find no differences between low- and high-density regions in terms of the median dust-corrected [OII] luminosity at all stellar masses probed in our sample.
Current usage metrics show cumulative count of Article Views (full-text article views including HTML views, PDF and ePub downloads, according to the available data) and Abstracts Views on Vision4Press platform.
Data correspond to usage on the plateform after 2015. The current usage metrics is available 48-96 hours after online publication and is updated daily on week days.
Initial download of the metrics may take a while.