Free Access
Fig. 4
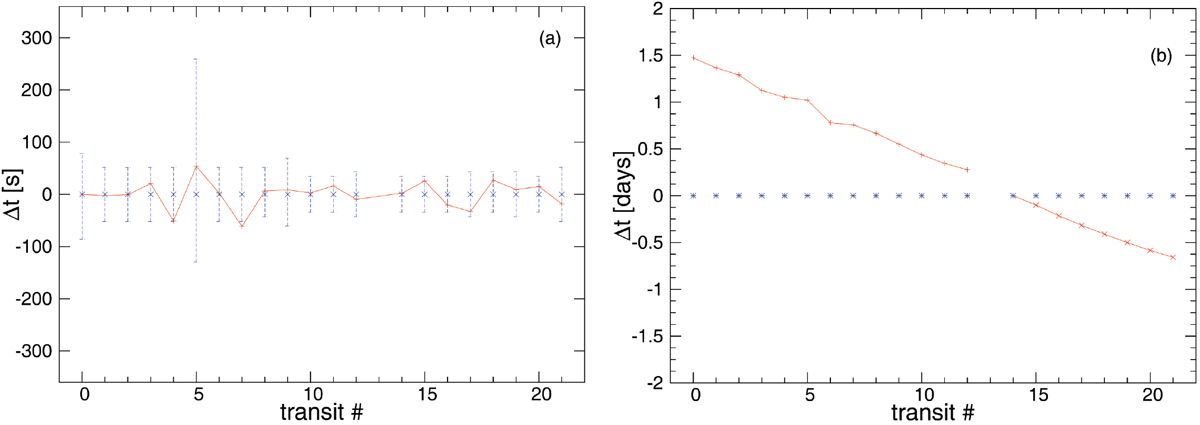
Panel a: differences tcom,i−tobs,i between thecomputed transits and the observed ones (plus signs joined with a solid line), and errors in the observed transits as reported in D14 (crosses with error bars). Panel b: as in panel a but with the parameters taken from D14. We note thedifferent scales on the plots.
Current usage metrics show cumulative count of Article Views (full-text article views including HTML views, PDF and ePub downloads, according to the available data) and Abstracts Views on Vision4Press platform.
Data correspond to usage on the plateform after 2015. The current usage metrics is available 48-96 hours after online publication and is updated daily on week days.
Initial download of the metrics may take a while.