Fig. 3
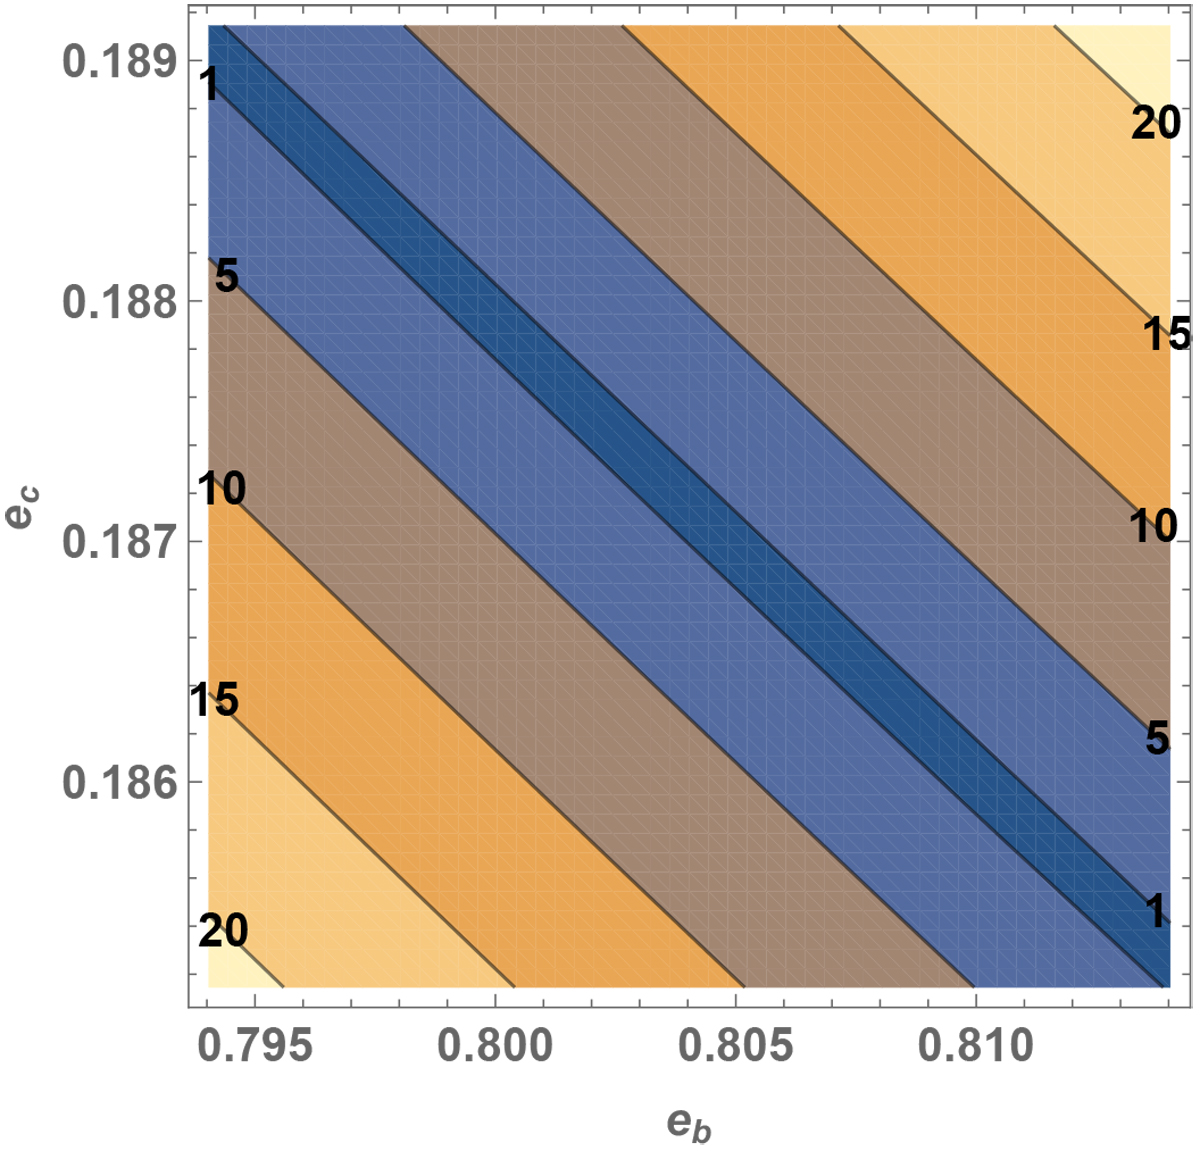
Contours of the root mean square of the differences between the resulting transits and the central values of the observed ones (i.e., ![]() ), as a function of the eccentricities of both planets. The contours are labeled with values in minutes. The narrow central band defines the region into which the eccentricities should lie in order to obtain one minute or less of error.
), as a function of the eccentricities of both planets. The contours are labeled with values in minutes. The narrow central band defines the region into which the eccentricities should lie in order to obtain one minute or less of error.
Current usage metrics show cumulative count of Article Views (full-text article views including HTML views, PDF and ePub downloads, according to the available data) and Abstracts Views on Vision4Press platform.
Data correspond to usage on the plateform after 2015. The current usage metrics is available 48-96 hours after online publication and is updated daily on week days.
Initial download of the metrics may take a while.