Fig. 2
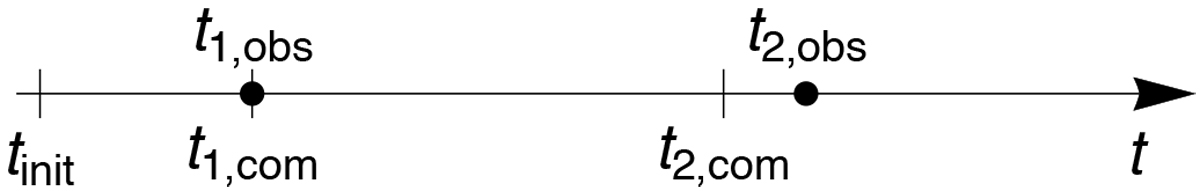
Time axis for each individual. The initial time of the integration and the first computedtransits are marked with vertical lines (lower labels); the observed transits are marked with dots (upper labels). At the first computed transit, a Julian date is assigned to t1,com corresponding to t1,obs. In this way, the instant tinit defining the elements gets a BJDTDB equal to the first transit minus the time elapsed since the start of the integration.
Current usage metrics show cumulative count of Article Views (full-text article views including HTML views, PDF and ePub downloads, according to the available data) and Abstracts Views on Vision4Press platform.
Data correspond to usage on the plateform after 2015. The current usage metrics is available 48-96 hours after online publication and is updated daily on week days.
Initial download of the metrics may take a while.