Fig. 5
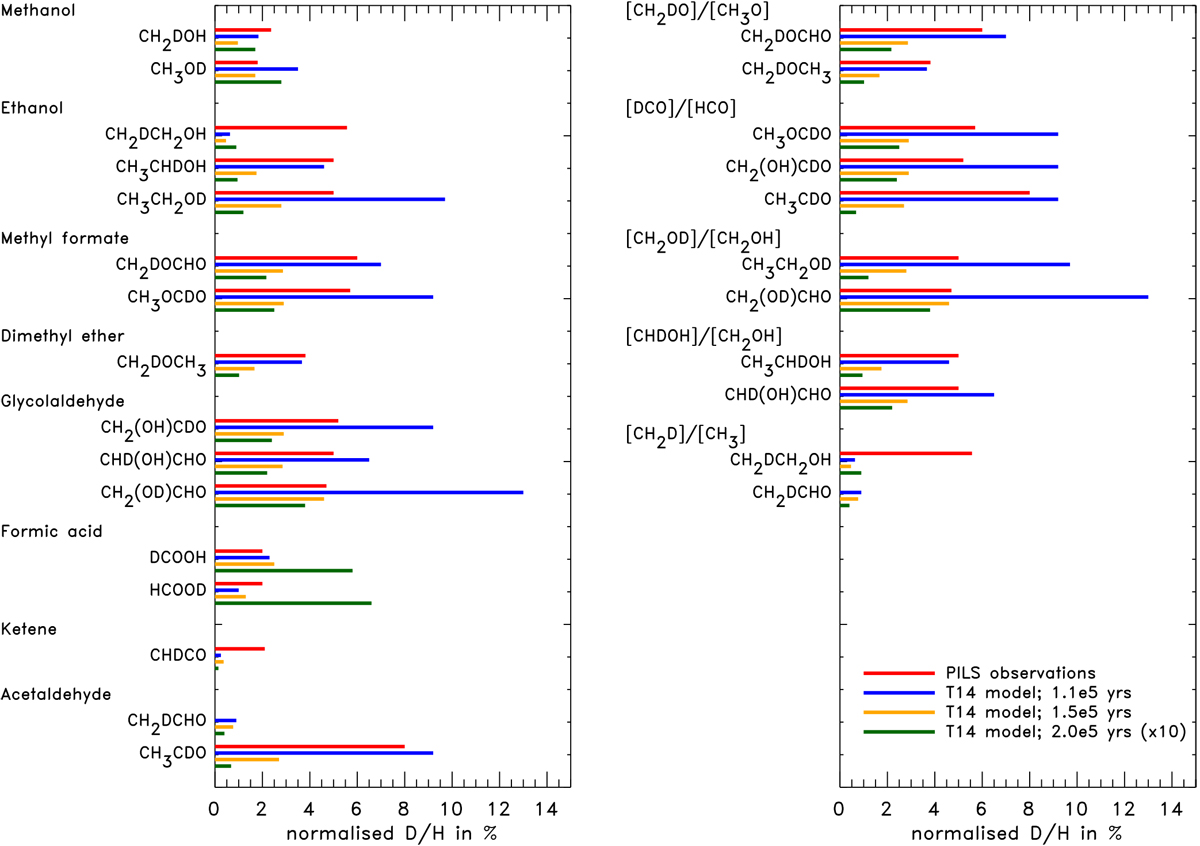
Comparison between the D/H ratios (per H-atom) for the complex organics sorted by species (left panel) and the leading radical in the formation (right panel). For each species, the PILS observations are represented by the first, red, bar and the predictions in the models by Taquet et al. (2014) after 1.1 × 10⁵, 1.5 × 10⁵ and 2.0 × 10⁵ years by the second (blue), third (orange) and fourth (green) bars, respectively (see also legend in the part of the right panel). For the model at 2.0 × 10⁵ years, the D/H ratios have been multiplied by a factor of 10 to enable comparisons.
Current usage metrics show cumulative count of Article Views (full-text article views including HTML views, PDF and ePub downloads, according to the available data) and Abstracts Views on Vision4Press platform.
Data correspond to usage on the plateform after 2015. The current usage metrics is available 48-96 hours after online publication and is updated daily on week days.
Initial download of the metrics may take a while.