Fig. 2
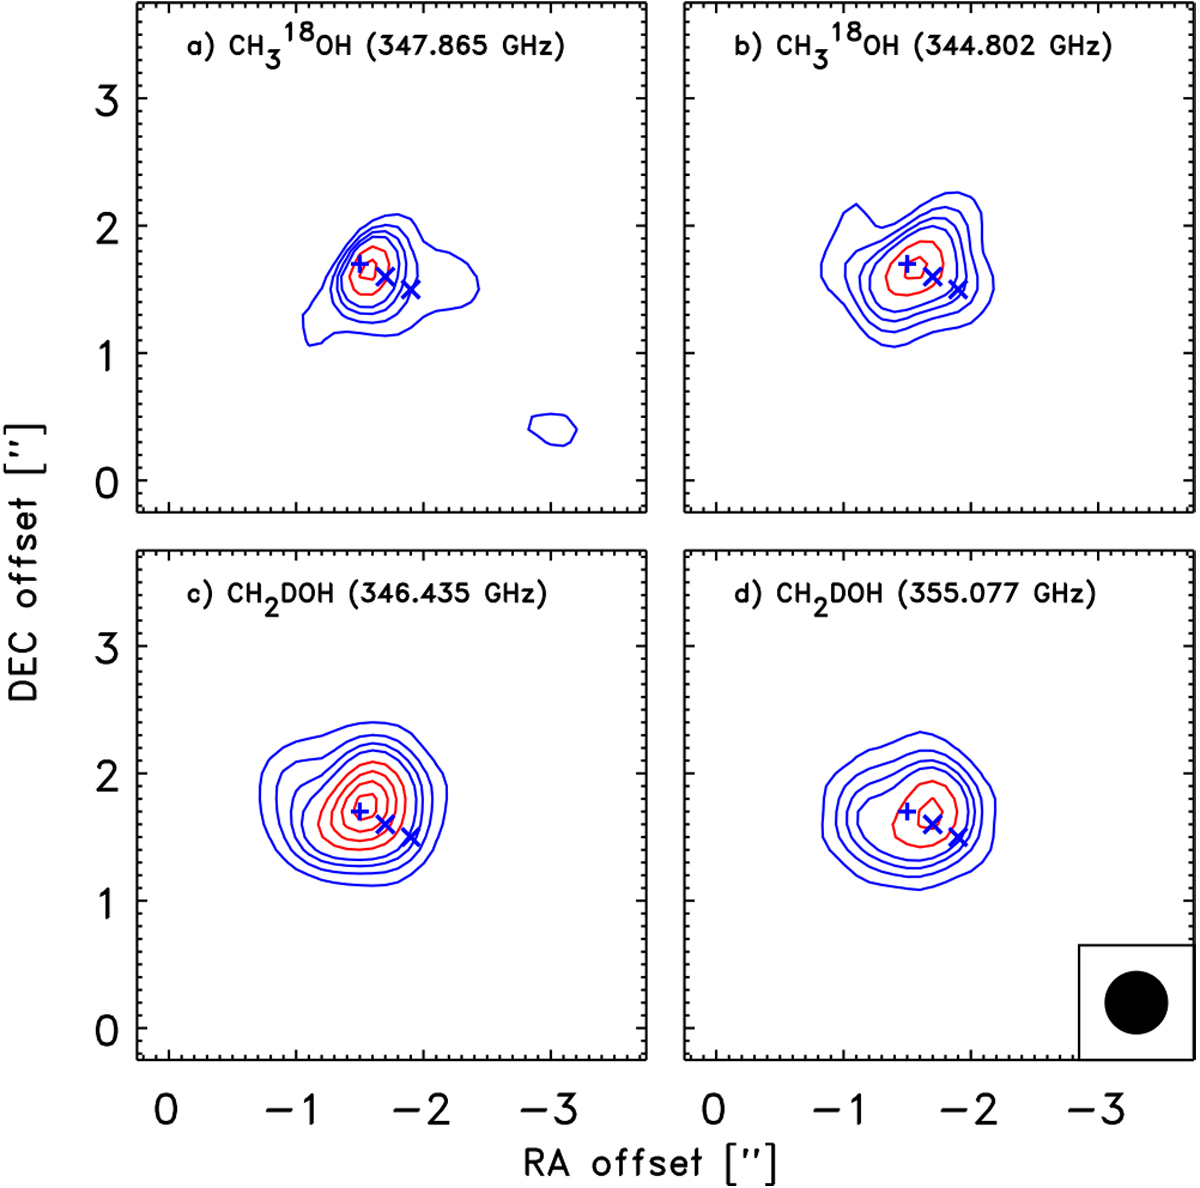
Representative maps for lines of CH![]() OH 83,6 − 92,8 (ν = 347.865 GHz; Eup = 143 K) and 171,17−162,15 (ν = 344.802 GHz; Eup = 345 K) in panels a and b, respectively, and CH2DOH 75,2∕3 − 84,5∕4 (ν = 346.43471 GHz; Eup = 176 K) and 172,15−163,14 (ν = 355.077 GHz; Eup = 364 K) in panels c and d, respectively. In all panels, the integrations were performed over ± 0.5 km s−1 around the systemic velocity and the contours shown at 3σ, 6σ, 9σ and 12σ (blue contours) and from there upwards in steps of 6σ (red contours).
OH 83,6 − 92,8 (ν = 347.865 GHz; Eup = 143 K) and 171,17−162,15 (ν = 344.802 GHz; Eup = 345 K) in panels a and b, respectively, and CH2DOH 75,2∕3 − 84,5∕4 (ν = 346.43471 GHz; Eup = 176 K) and 172,15−163,14 (ν = 355.077 GHz; Eup = 364 K) in panels c and d, respectively. In all panels, the integrations were performed over ± 0.5 km s−1 around the systemic velocity and the contours shown at 3σ, 6σ, 9σ and 12σ (blue contours) and from there upwards in steps of 6σ (red contours).
Current usage metrics show cumulative count of Article Views (full-text article views including HTML views, PDF and ePub downloads, according to the available data) and Abstracts Views on Vision4Press platform.
Data correspond to usage on the plateform after 2015. The current usage metrics is available 48-96 hours after online publication and is updated daily on week days.
Initial download of the metrics may take a while.