Fig. 1
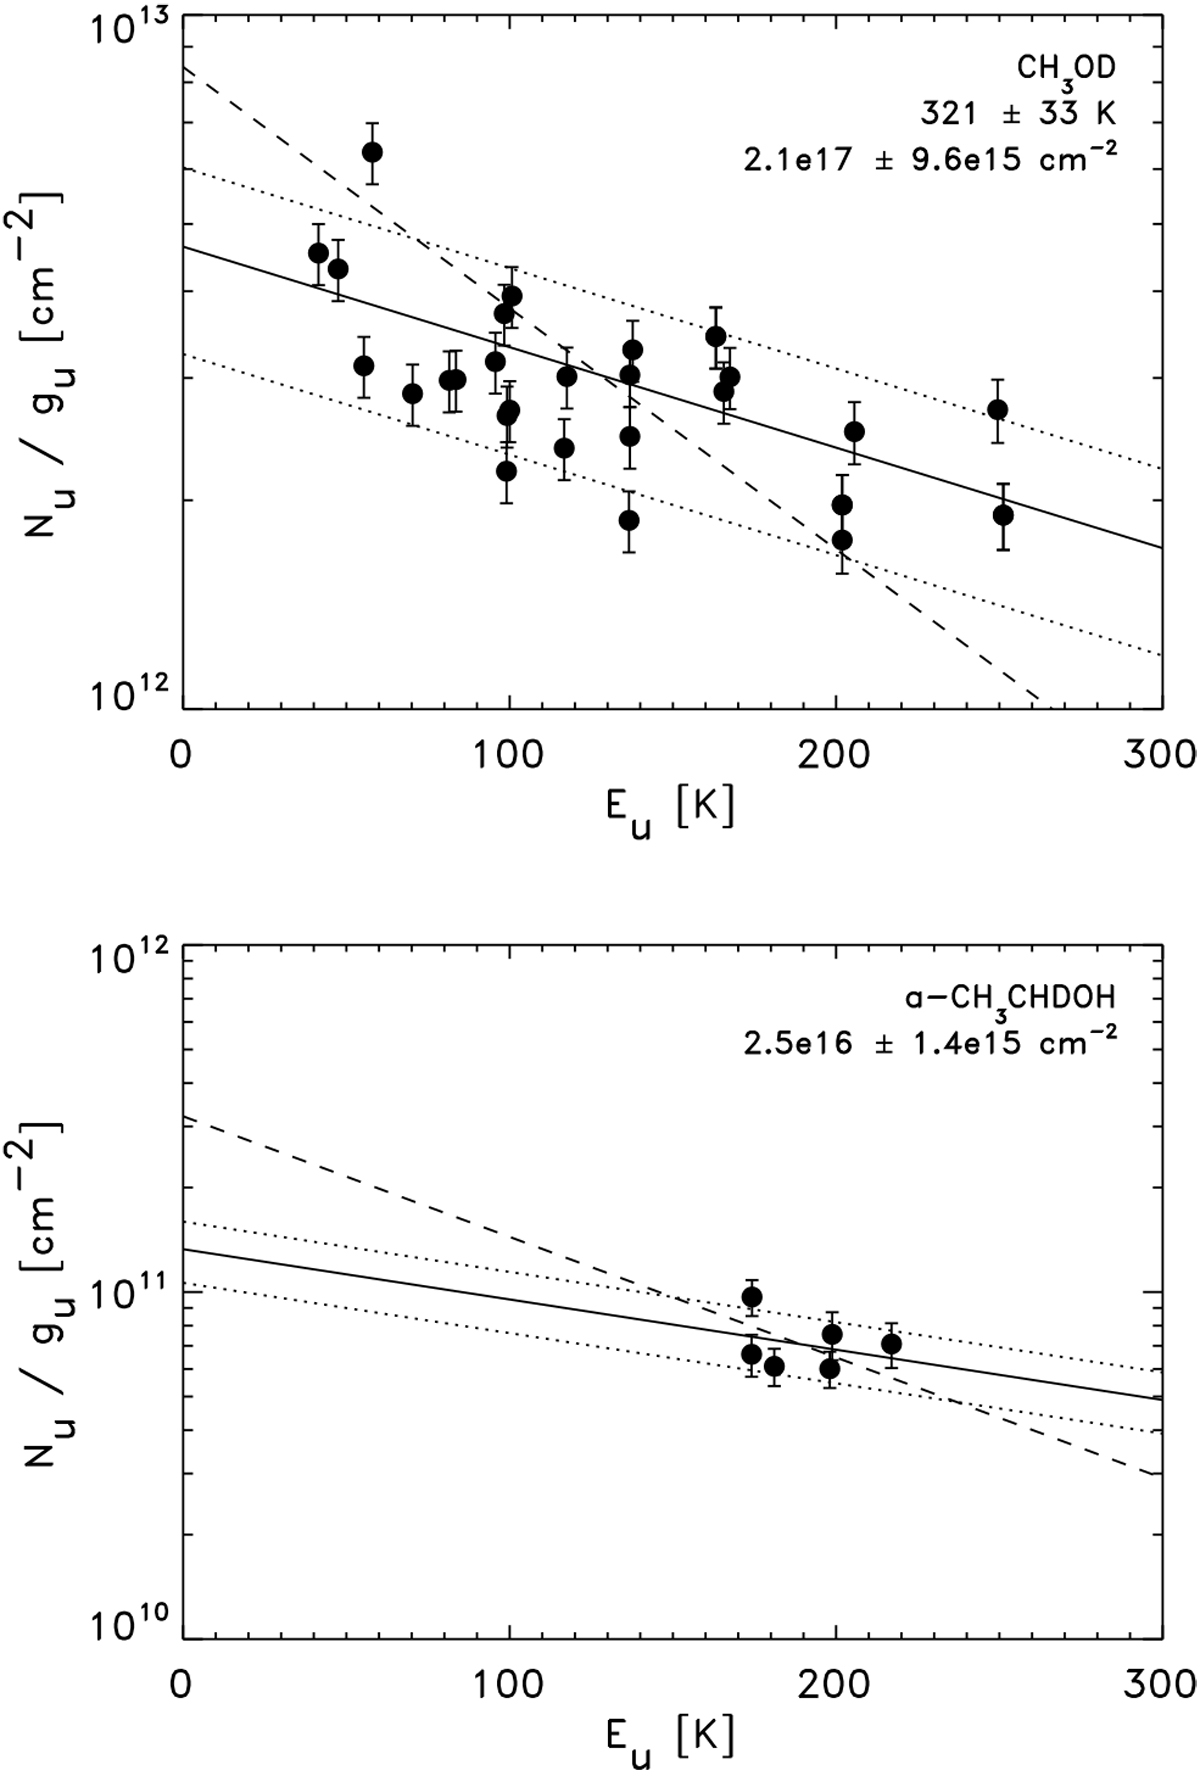
Rotation diagrams for well-isolated lines of CH3OD (upper panel) and CH3CHDOH (lower panel). For the former, both rotation temperature and column density can be constrained, while the limited range of CH3 OD transitions only allow us to constrain the column density for that species. In both panels, the best fit is shown with the solid line with our conservative estimates on the uncertainties represented by the dotted lines (the best fit values given in the upper right corner of each panels). The dashed lines in both panels indicate the best fits assuming a fixed rotation temperature of 125 K: this temperature clearly does not match the data for CH3 OD over the range of upper energies for the observed lines.
Current usage metrics show cumulative count of Article Views (full-text article views including HTML views, PDF and ePub downloads, according to the available data) and Abstracts Views on Vision4Press platform.
Data correspond to usage on the plateform after 2015. The current usage metrics is available 48-96 hours after online publication and is updated daily on week days.
Initial download of the metrics may take a while.