Fig. 9
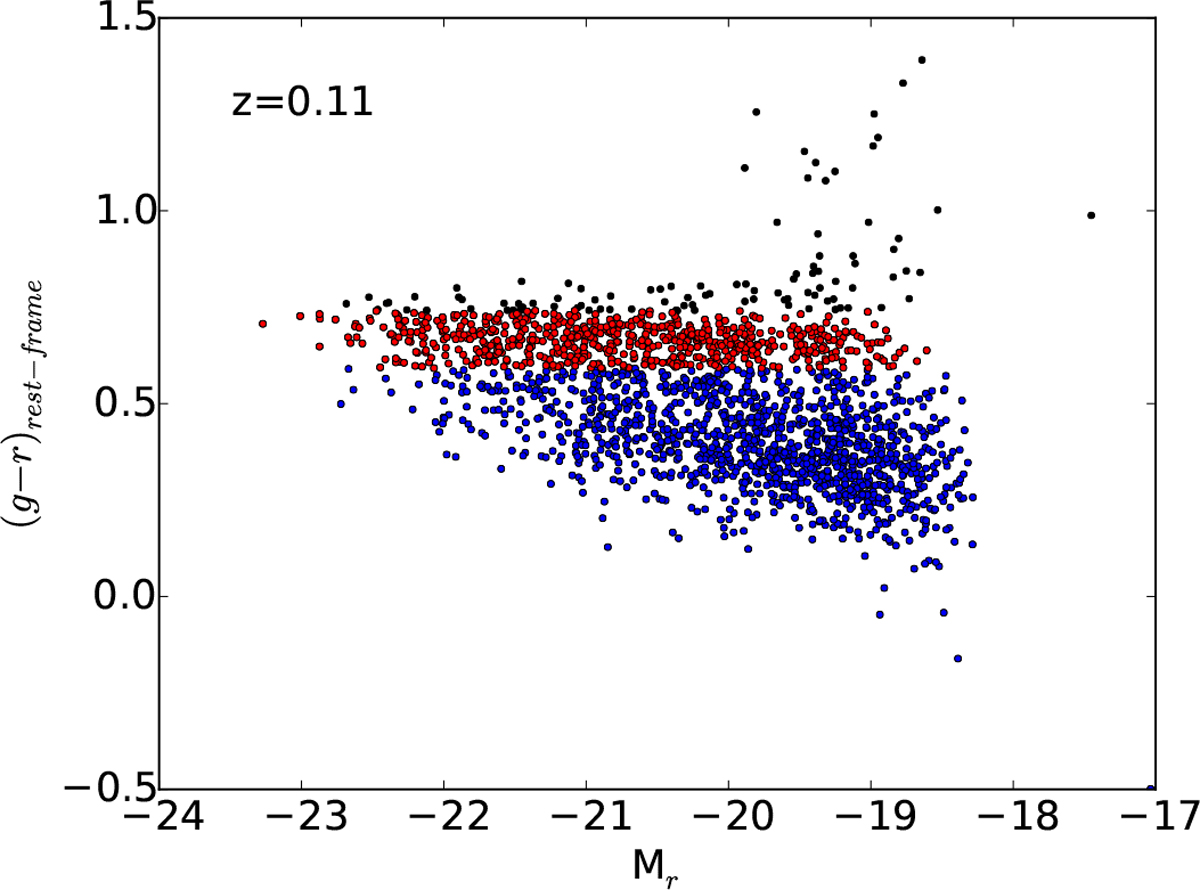
Colour–magnitude diagram for galaxies in the redshift bin centred around z = 0.11. Black pointsare the 5% reddest galaxies excluded as outliers in the first step of the mass completeness limit computation. Red points represent the 0.15 width colour stripe used to define the absolute magnitude limit starting from the rest-frame colour limit (see text). Blue points are all other objects which are not considered for the mass limit computation.
Current usage metrics show cumulative count of Article Views (full-text article views including HTML views, PDF and ePub downloads, according to the available data) and Abstracts Views on Vision4Press platform.
Data correspond to usage on the plateform after 2015. The current usage metrics is available 48-96 hours after online publication and is updated daily on week days.
Initial download of the metrics may take a while.