Fig. 2
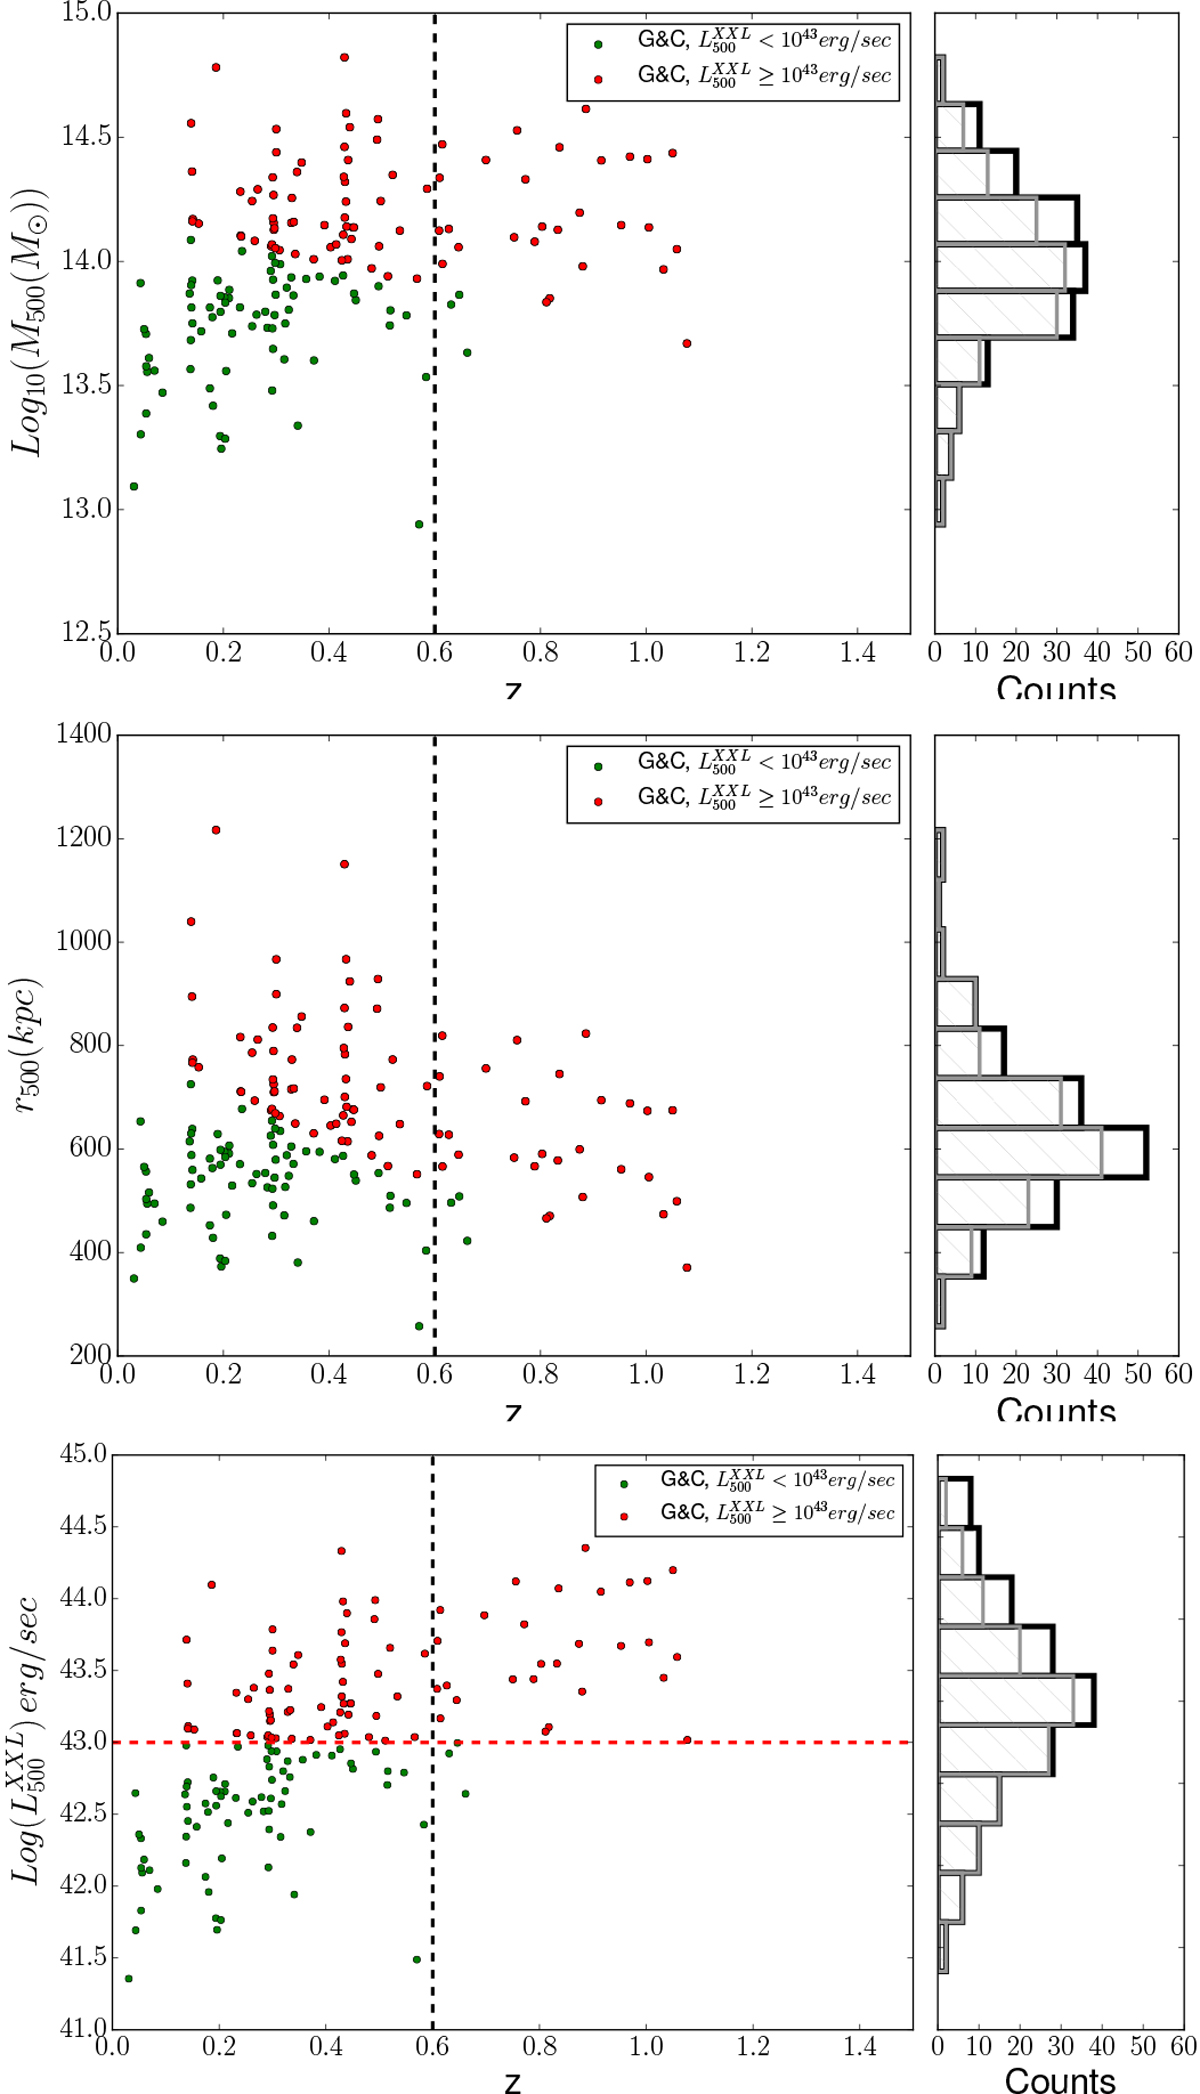
Main panels: M500,scal (upper), r500,scal (middle), ![]() (bottom) vs. redshift for the 164 XXL-N c1+c2 G&C with estimates of M500,scal and r500,scal. The distribution of the same quantities is shown in the corresponding right panels, where black histograms refer to all G&C in the sample, and grey hatched histograms are for z ≤ 0.6 G&C. In the main panels, the vertical black dashed line corresponds to z = 0.6, the maximum redshift of G&C considered in this work. High-luminosity G&C are marked in red, low-luminosity G&C in green. In the bottom panel, the horizontal red dashed line corresponds to the luminosity used to separate the G&C into two classes (see text for details).
(bottom) vs. redshift for the 164 XXL-N c1+c2 G&C with estimates of M500,scal and r500,scal. The distribution of the same quantities is shown in the corresponding right panels, where black histograms refer to all G&C in the sample, and grey hatched histograms are for z ≤ 0.6 G&C. In the main panels, the vertical black dashed line corresponds to z = 0.6, the maximum redshift of G&C considered in this work. High-luminosity G&C are marked in red, low-luminosity G&C in green. In the bottom panel, the horizontal red dashed line corresponds to the luminosity used to separate the G&C into two classes (see text for details).
Current usage metrics show cumulative count of Article Views (full-text article views including HTML views, PDF and ePub downloads, according to the available data) and Abstracts Views on Vision4Press platform.
Data correspond to usage on the plateform after 2015. The current usage metrics is available 48-96 hours after online publication and is updated daily on week days.
Initial download of the metrics may take a while.