Fig. A.3
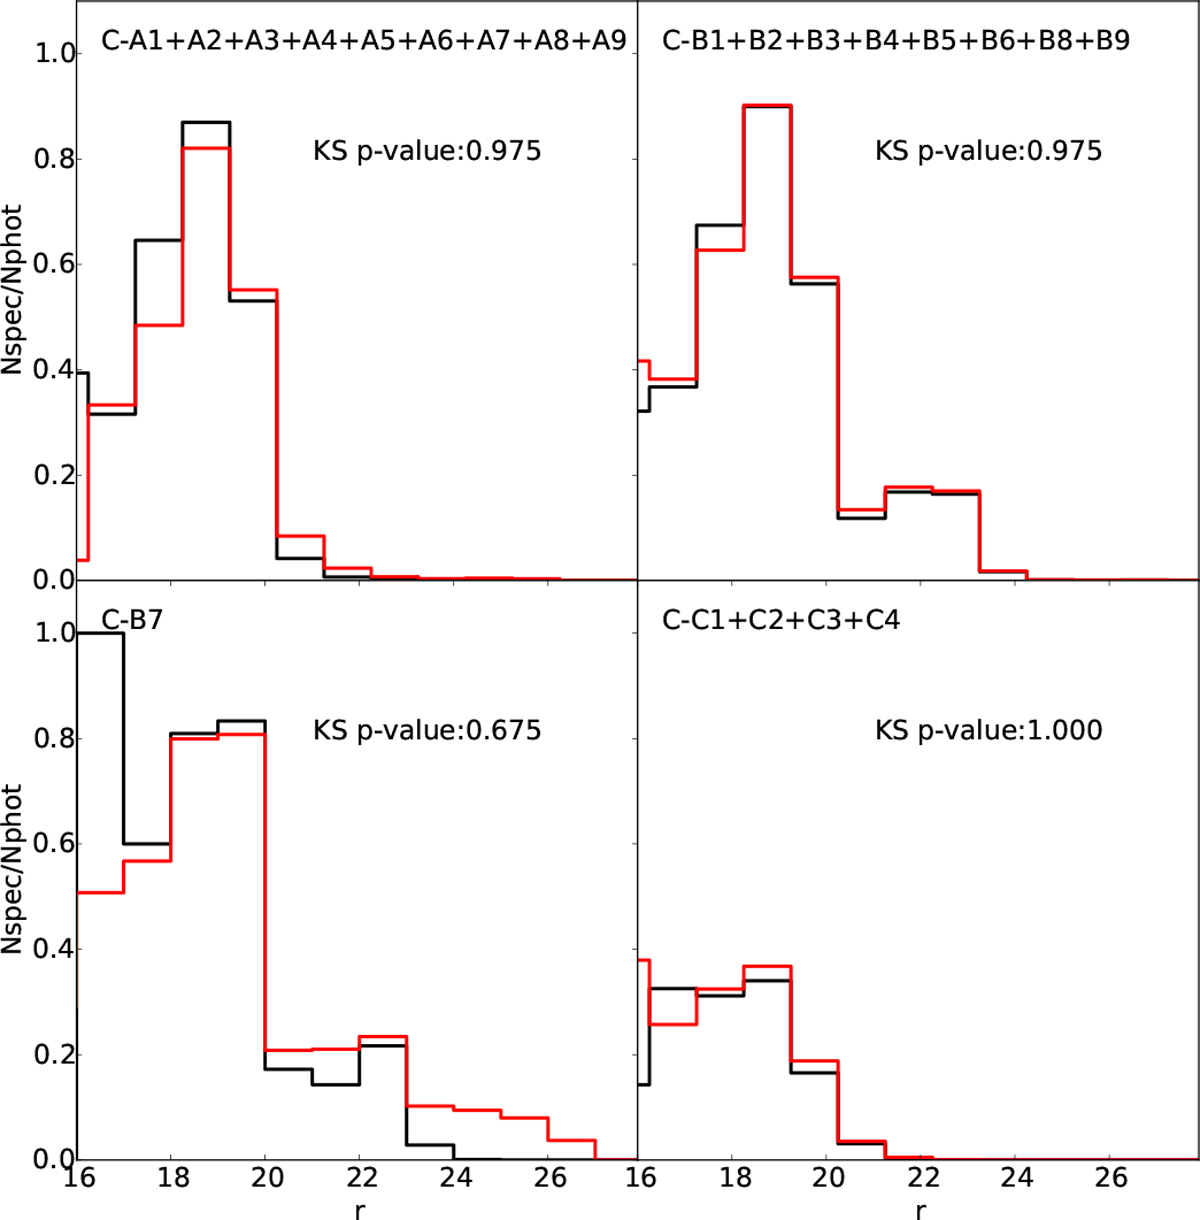
Completeness curves as a function of r-band magnitude and environment in the four representative regions discussed in the main text, as indicated in each panel. Galaxies in the projected area of G&C are shown in red, field galaxies are shown in black (see Sect. 3 for the definitions of the environments). In all the cases, the KS test on the histograms at r ≤ 20 finds no significant differences between the considered samples, as shown by the p-values indicated in each panel.
Current usage metrics show cumulative count of Article Views (full-text article views including HTML views, PDF and ePub downloads, according to the available data) and Abstracts Views on Vision4Press platform.
Data correspond to usage on the plateform after 2015. The current usage metrics is available 48-96 hours after online publication and is updated daily on week days.
Initial download of the metrics may take a while.