Fig. 15
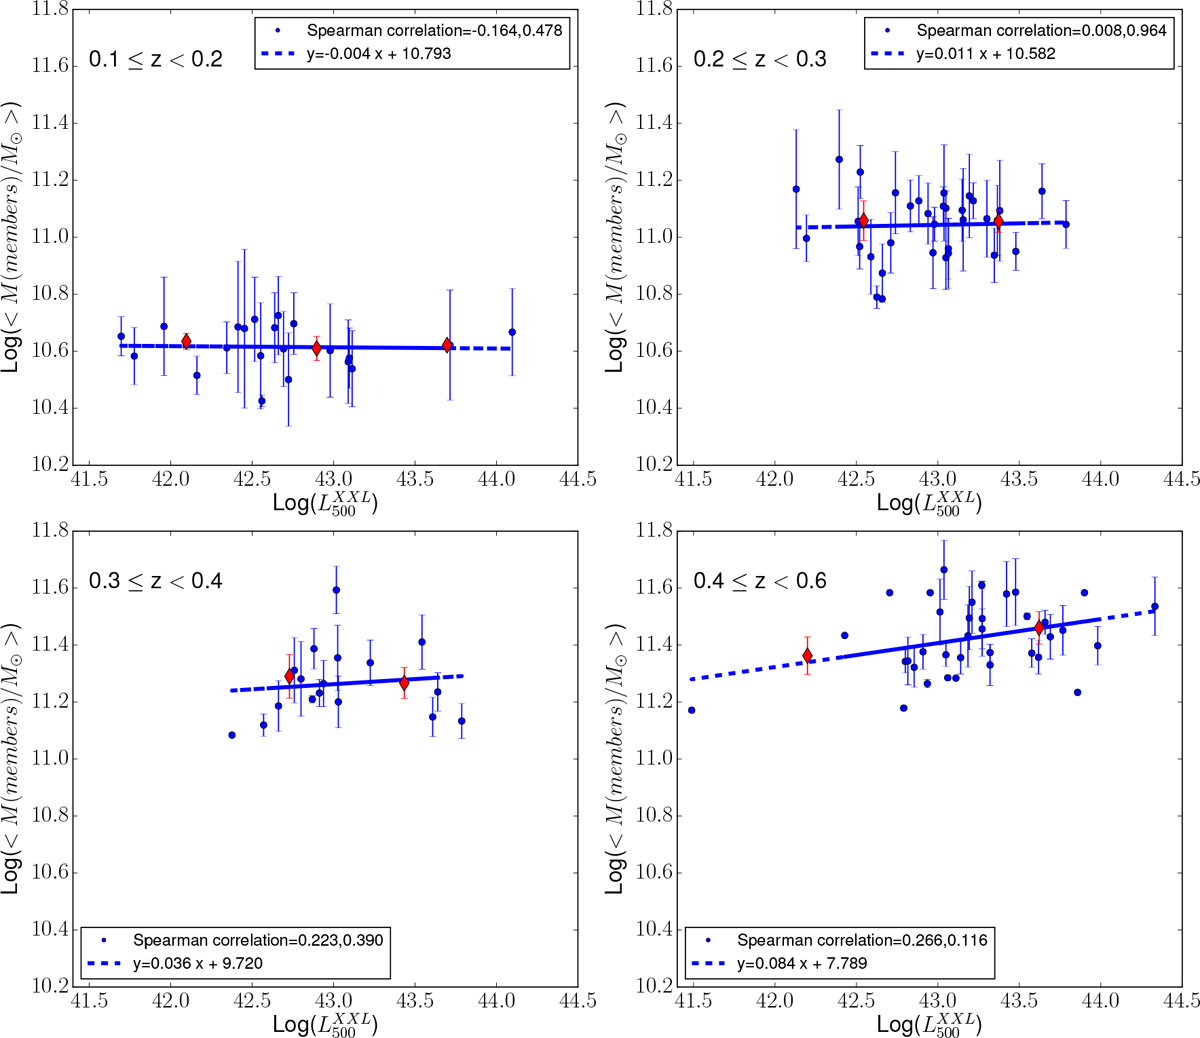
Correlation between the mean mass of member galaxies of G&C and the X-ray luminosity of the host G&C (blue dots) in the four redshift bins where the stellar mass function was computed. The mean value of the y-axis quantitywas computed in equally populated bins of X-ray luminosity (three at z = 0.1−0.2, two in the other redshift intervals) and is shown with red diamonds. Least-squares fits are shown with dashed lines in the figure and the least-squares fit parameters are shown in the legend.
Current usage metrics show cumulative count of Article Views (full-text article views including HTML views, PDF and ePub downloads, according to the available data) and Abstracts Views on Vision4Press platform.
Data correspond to usage on the plateform after 2015. The current usage metrics is available 48-96 hours after online publication and is updated daily on week days.
Initial download of the metrics may take a while.