Fig. 12
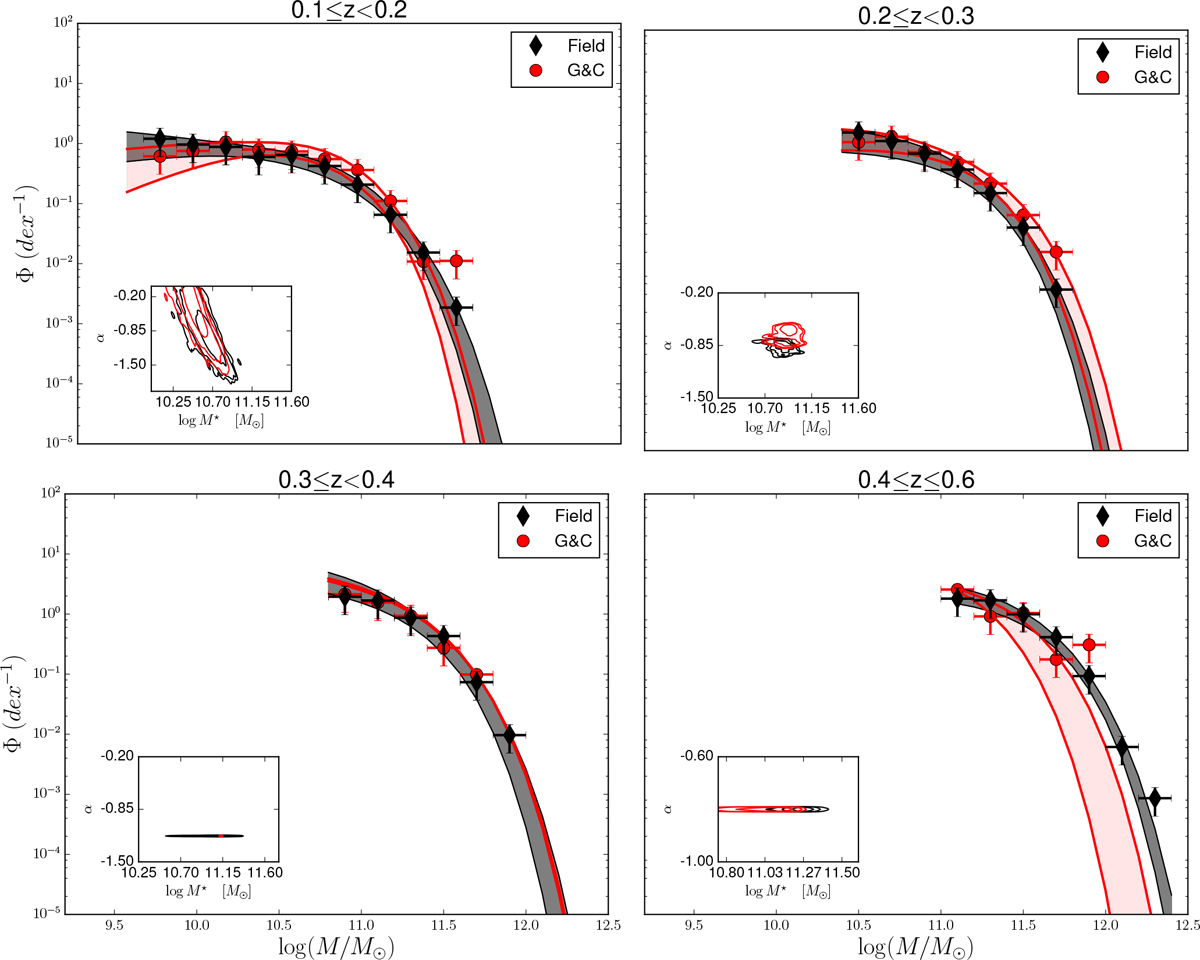
Galaxy stellar mass function in different redshift ranges, as indicated in each panel, for galaxies in G&C (red points) and in the field (black diamonds). Only points above the mass completeness limit are shown. Error bars on the x-axis show the width of the mass bins; those on the y-axis are derived from Poisson’s statistics on the number counts together with the cosmic variance contribution. Schechter fit functions are also shown as shaded areas and follow the same colour scheme as the points. In the insets, 1, 2, 3σ contour plots on the Schechter fit parameters α and M* are also shown. At z ≥ 0.3, fixed values for the faint end slope α were set in order to perform Schechter fits.
Current usage metrics show cumulative count of Article Views (full-text article views including HTML views, PDF and ePub downloads, according to the available data) and Abstracts Views on Vision4Press platform.
Data correspond to usage on the plateform after 2015. The current usage metrics is available 48-96 hours after online publication and is updated daily on week days.
Initial download of the metrics may take a while.