Free Access
Fig. 10
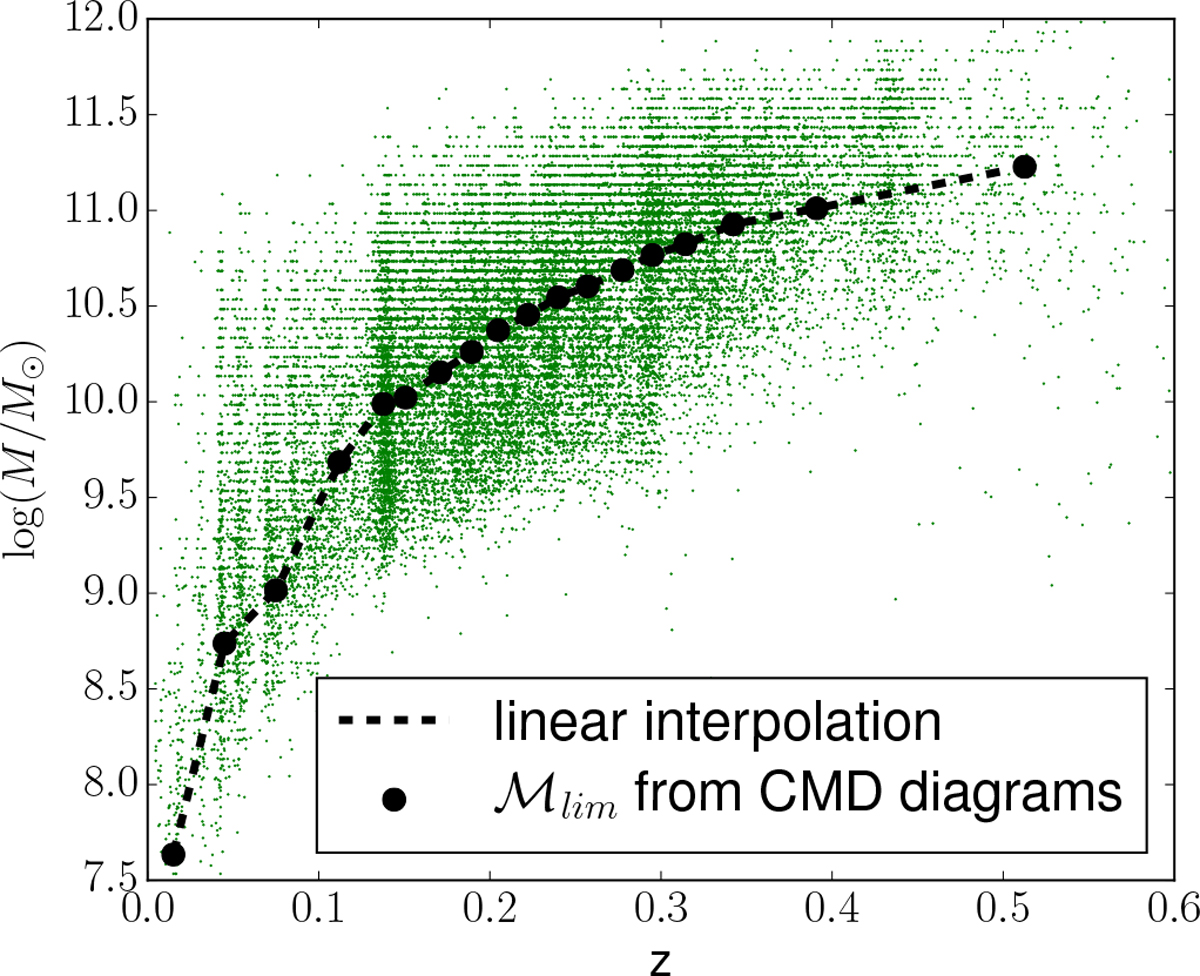
Stellar mass completeness limit as a function of redshift. The black points represent the measured limit (see text). The black dotted line is the linear interpolation to the points. Green dots represent the entire galaxy sample.
Current usage metrics show cumulative count of Article Views (full-text article views including HTML views, PDF and ePub downloads, according to the available data) and Abstracts Views on Vision4Press platform.
Data correspond to usage on the plateform after 2015. The current usage metrics is available 48-96 hours after online publication and is updated daily on week days.
Initial download of the metrics may take a while.