Free Access
Fig. 1
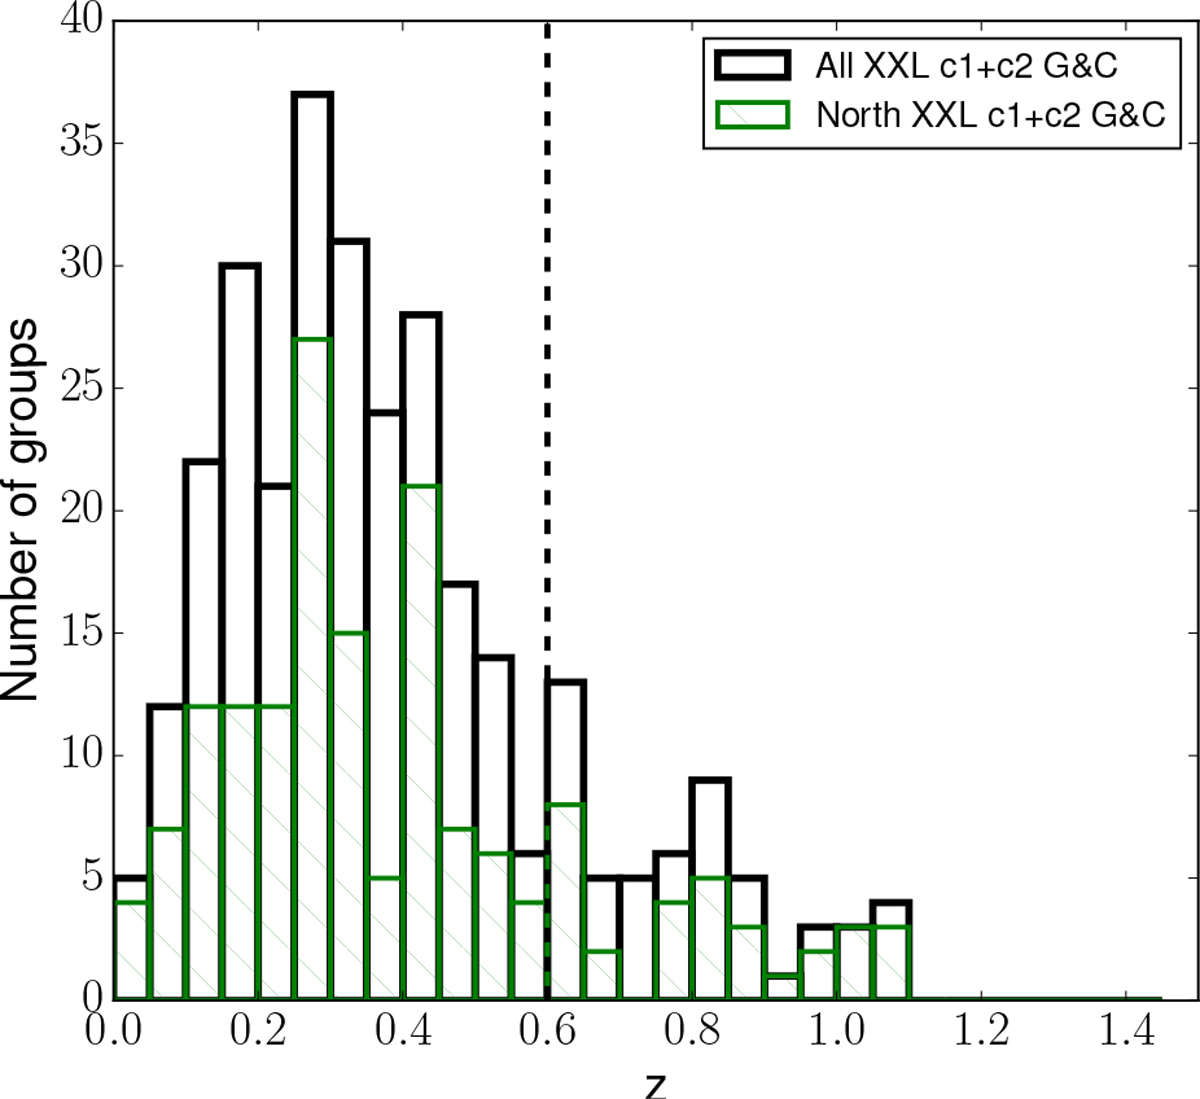
Redshift distribution of all 302 spectroscopically confirmed XXL c1+c2 G&C (black), and of the 164 in the XXL-N area (green). The vertical black dashed line corresponds to z = 0.6, the maximum redshift of G&C considered in this work.
Current usage metrics show cumulative count of Article Views (full-text article views including HTML views, PDF and ePub downloads, according to the available data) and Abstracts Views on Vision4Press platform.
Data correspond to usage on the plateform after 2015. The current usage metrics is available 48-96 hours after online publication and is updated daily on week days.
Initial download of the metrics may take a while.