Fig. 9.
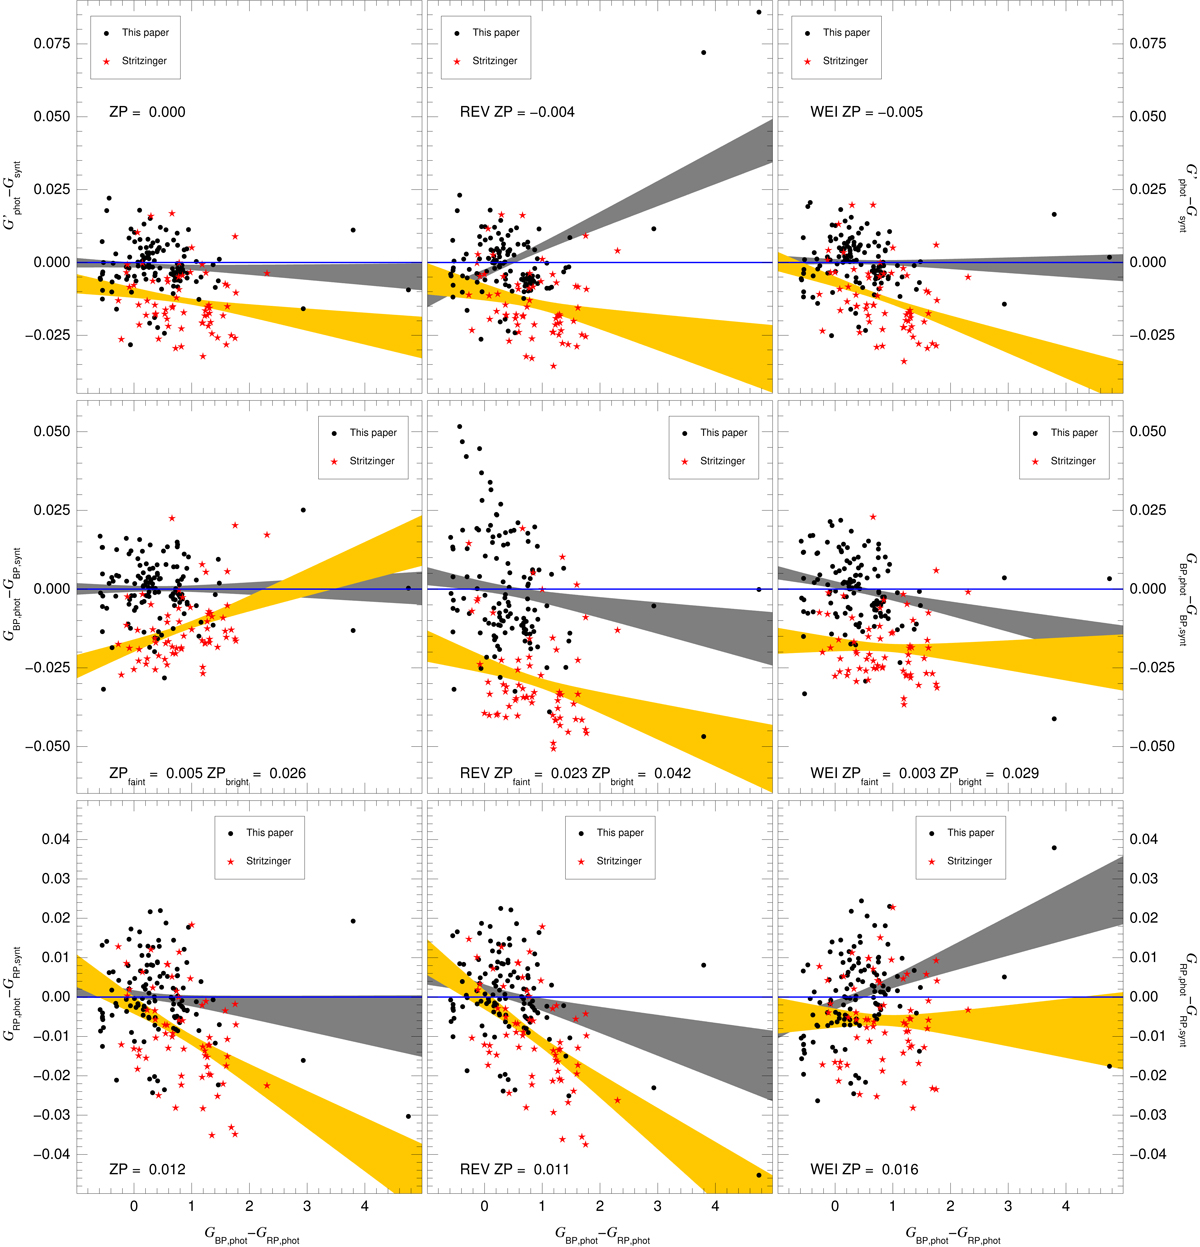
Comparison between the (corrected in the G case) observed magnitudes and the synthetic G magnitudes as a function of GBP, phot − GRP, phot for the sample in this paper (black circles) and the Stritzinger sample (red stars). The top, middle, and bottom rows show the results for G, GBP, and GRP, respectively. The left, center, and right columns show the results for MAW, REV, and WEI, respectively. The region shaded in gray shows the 1σ confidence range for the unrestricted fit for the sample in this paper. The region shaded in light orange shows the equivalent for the Stritzinger sample.
Current usage metrics show cumulative count of Article Views (full-text article views including HTML views, PDF and ePub downloads, according to the available data) and Abstracts Views on Vision4Press platform.
Data correspond to usage on the plateform after 2015. The current usage metrics is available 48-96 hours after online publication and is updated daily on week days.
Initial download of the metrics may take a while.