Fig. 6.
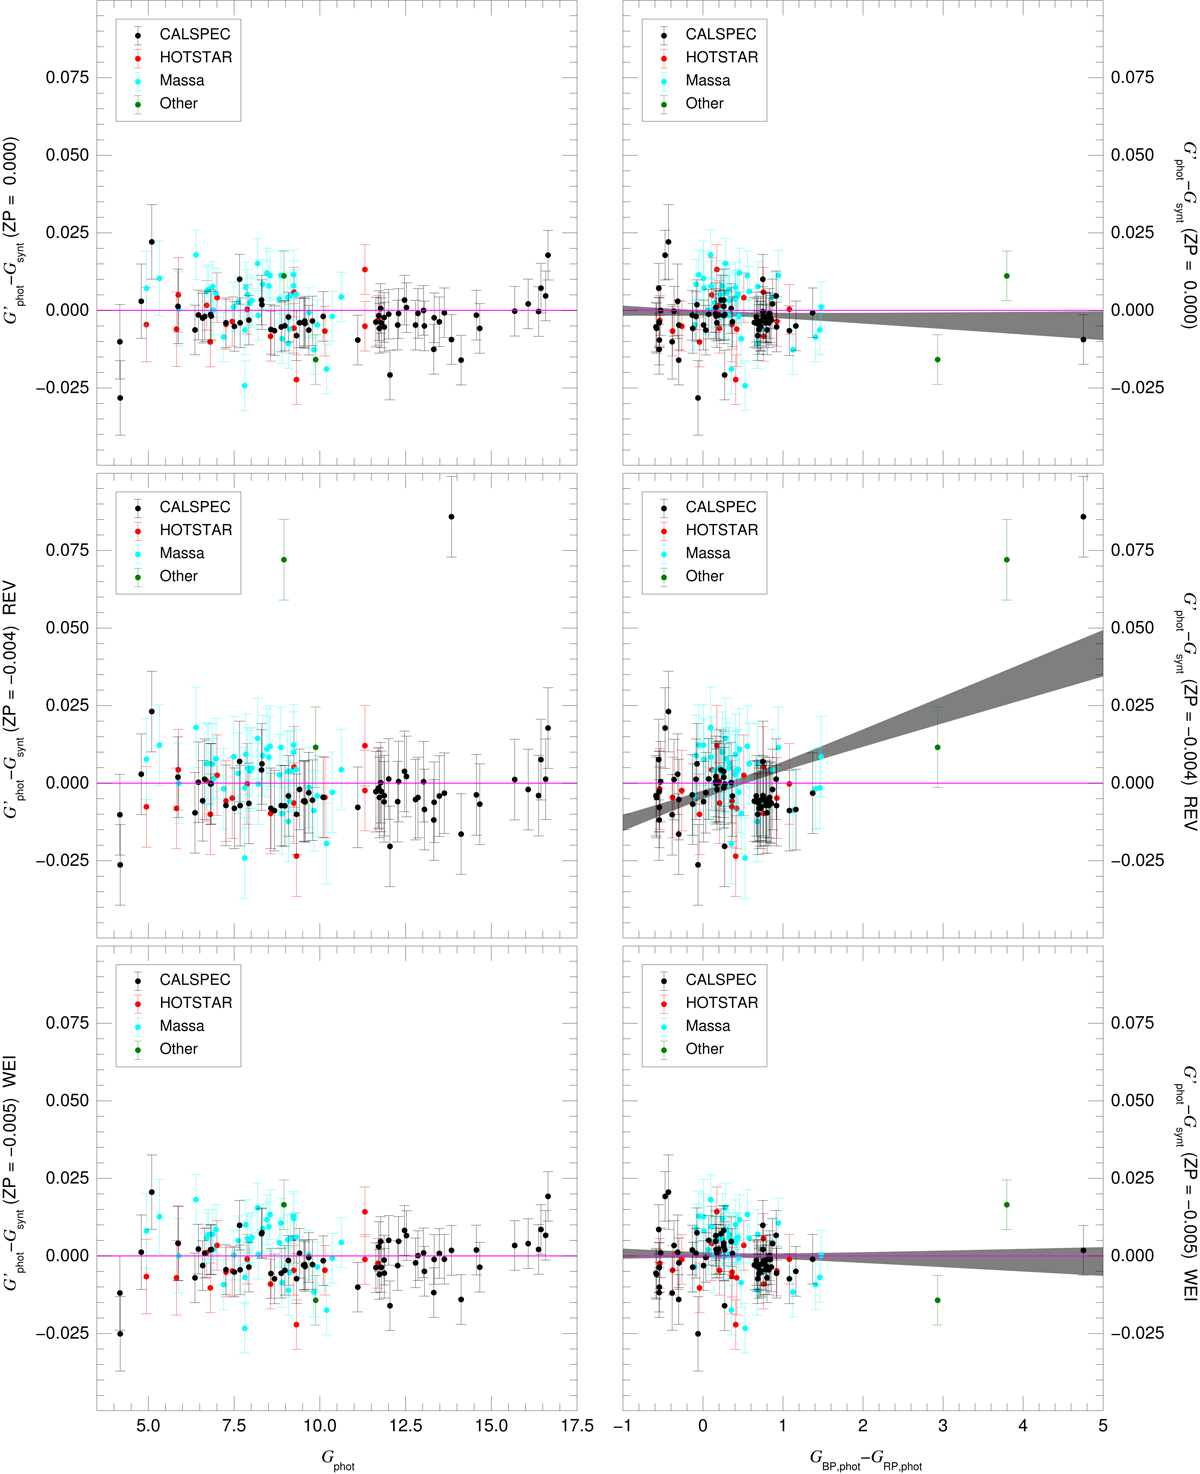
Comparison between the corrected observed G magnitudes and the synthetic G magnitudes as a function of Gphot (left column) and as a function of GBP, phot − GRP, phot (right column). The first, second, and third row show the result for MAW, REV, and WEI, respectively. Data points and error bars are color-coded by data set. The region shaded in gray in the right column shows the 1σ confidence range for the unrestricted fit.
Current usage metrics show cumulative count of Article Views (full-text article views including HTML views, PDF and ePub downloads, according to the available data) and Abstracts Views on Vision4Press platform.
Data correspond to usage on the plateform after 2015. The current usage metrics is available 48-96 hours after online publication and is updated daily on week days.
Initial download of the metrics may take a while.