Free Access
Fig. 2.
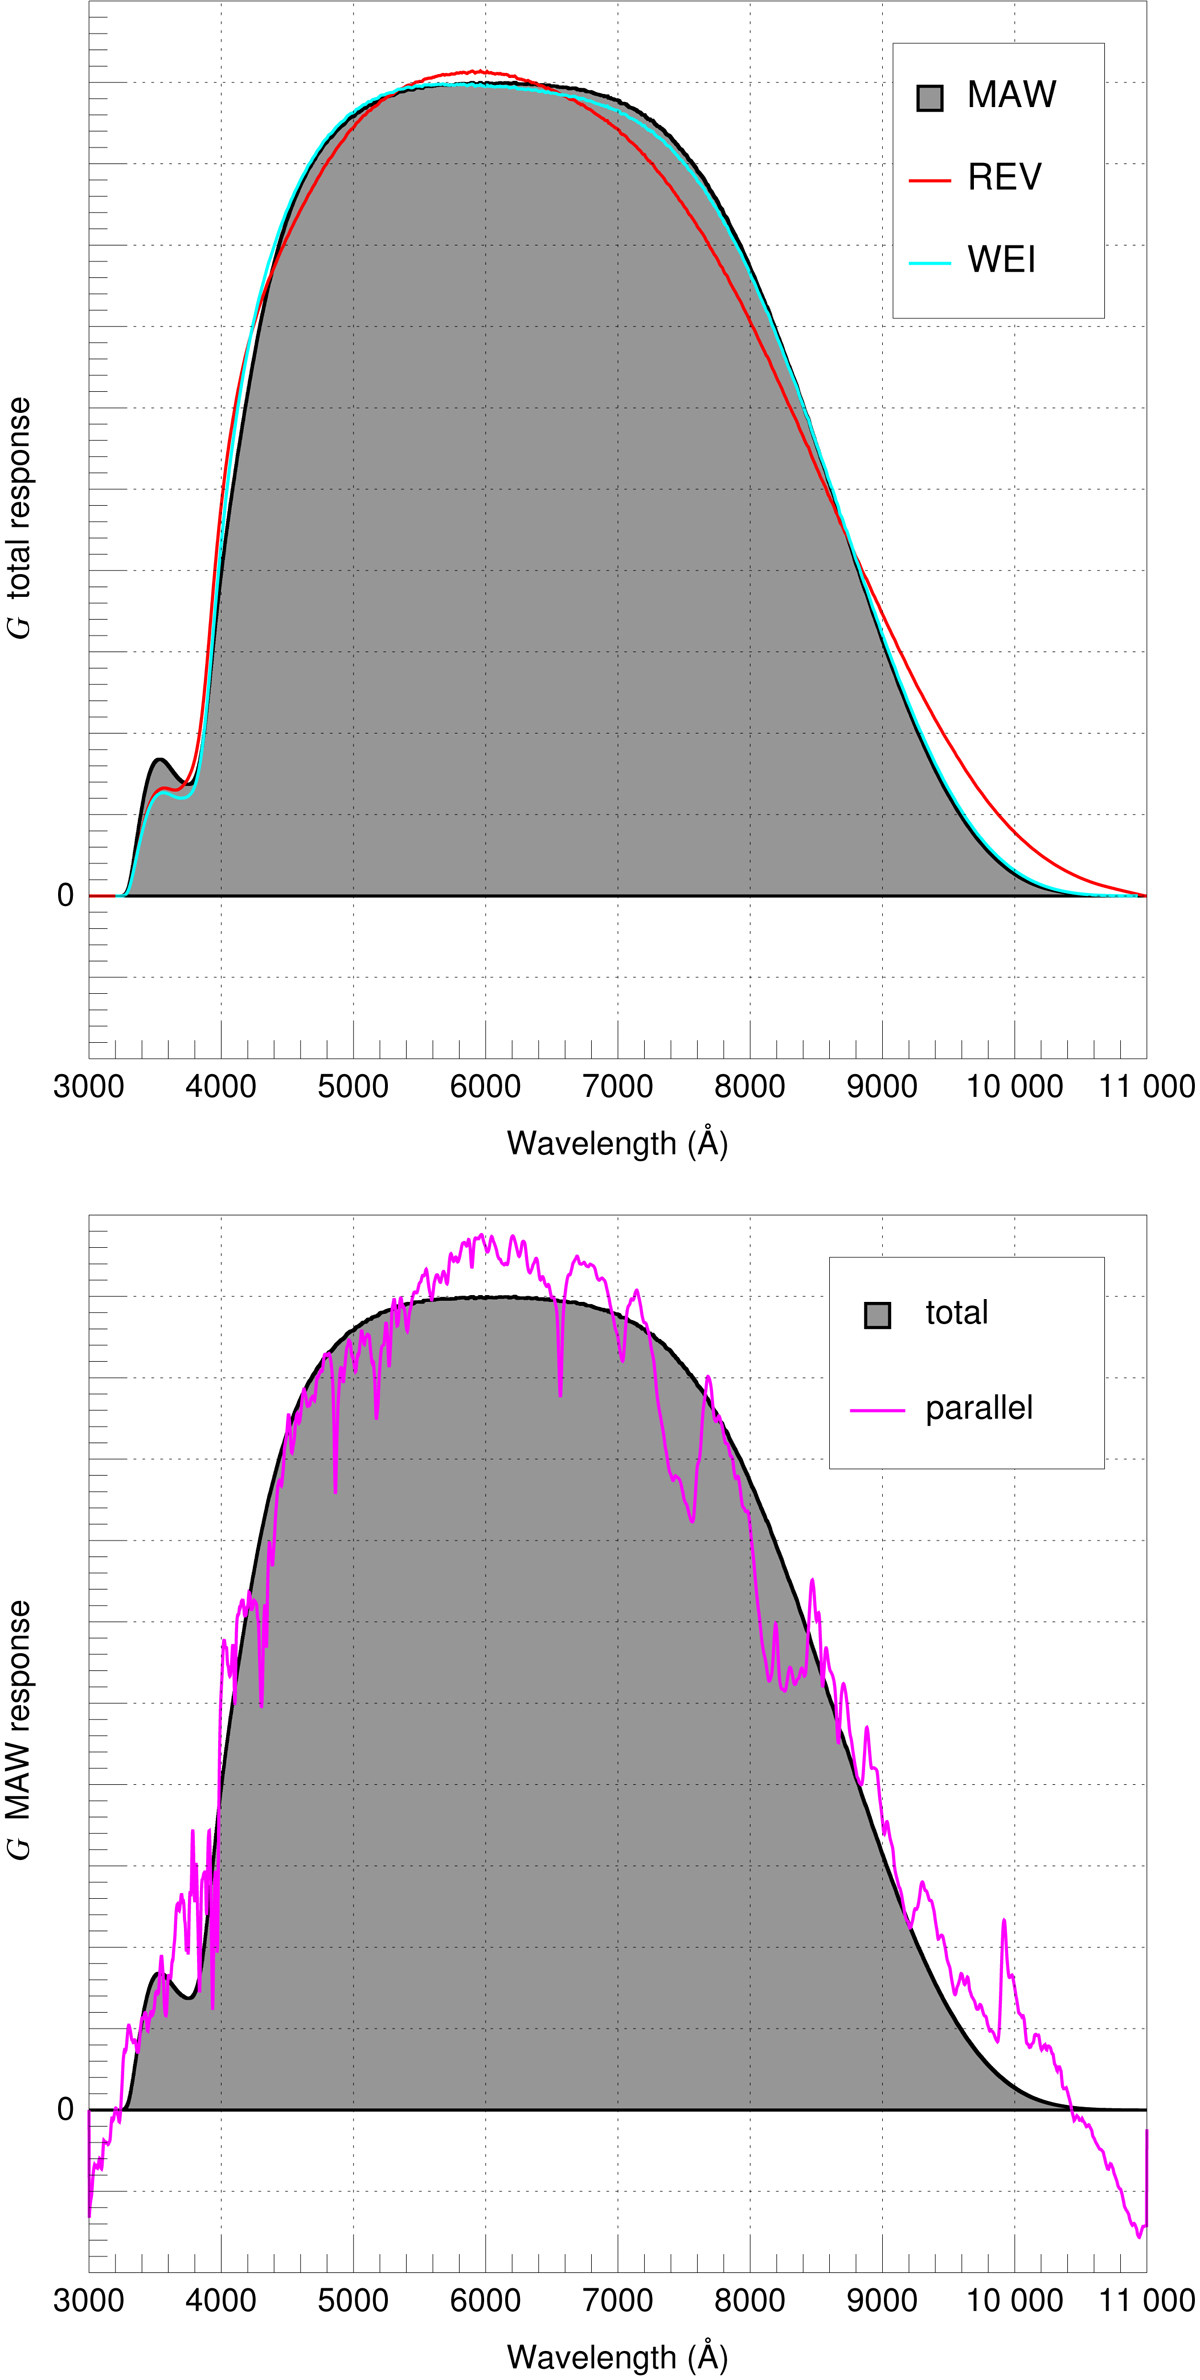
G sensitivity curves. Top: total responses for this work (MAW), Evans et al. 2018 (REV), and Weiler 2018 (WEI) normalized to the same area. Bottom: total response and parallel component for this work with the same scale as on the top panel.
Current usage metrics show cumulative count of Article Views (full-text article views including HTML views, PDF and ePub downloads, according to the available data) and Abstracts Views on Vision4Press platform.
Data correspond to usage on the plateform after 2015. The current usage metrics is available 48-96 hours after online publication and is updated daily on week days.
Initial download of the metrics may take a while.