Fig. 10.
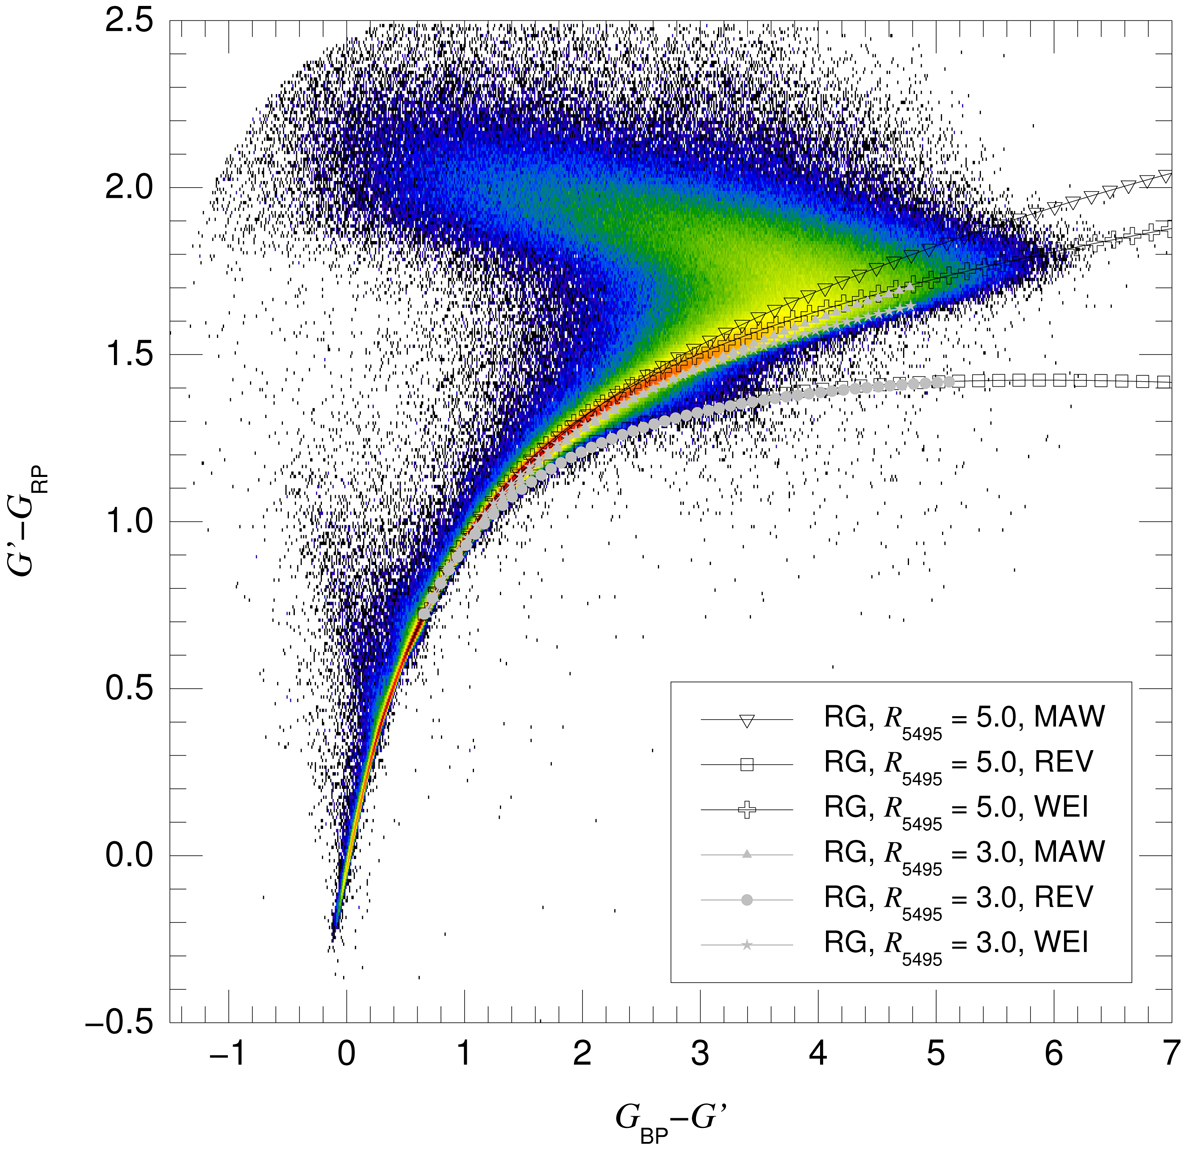
GBP − G′ vs. G′−GRP diagram that includes all stars with 2MASS counterparts, good-quality photometry, and K < 9 mag. The intensity scale is logarithmic. The lines with symbols mark the extinction trajectories of a red giant with Gphot > 10.87 mag using the family of extinction laws of Maíz Apellániz et al. (2014; symbols are spaced by ΔE(4405 − 5495)=0.1 mag and reach to E(4405 − 5495)=5.0 mag) combined in six ways by selecting (a) R5495 = 3 (normal extinction) or R5495 = 5 (H II region extinction) and (b) MAW, REV, or WEI sensitivity curves. See the text for more details.
Current usage metrics show cumulative count of Article Views (full-text article views including HTML views, PDF and ePub downloads, according to the available data) and Abstracts Views on Vision4Press platform.
Data correspond to usage on the plateform after 2015. The current usage metrics is available 48-96 hours after online publication and is updated daily on week days.
Initial download of the metrics may take a while.