Fig. 1.
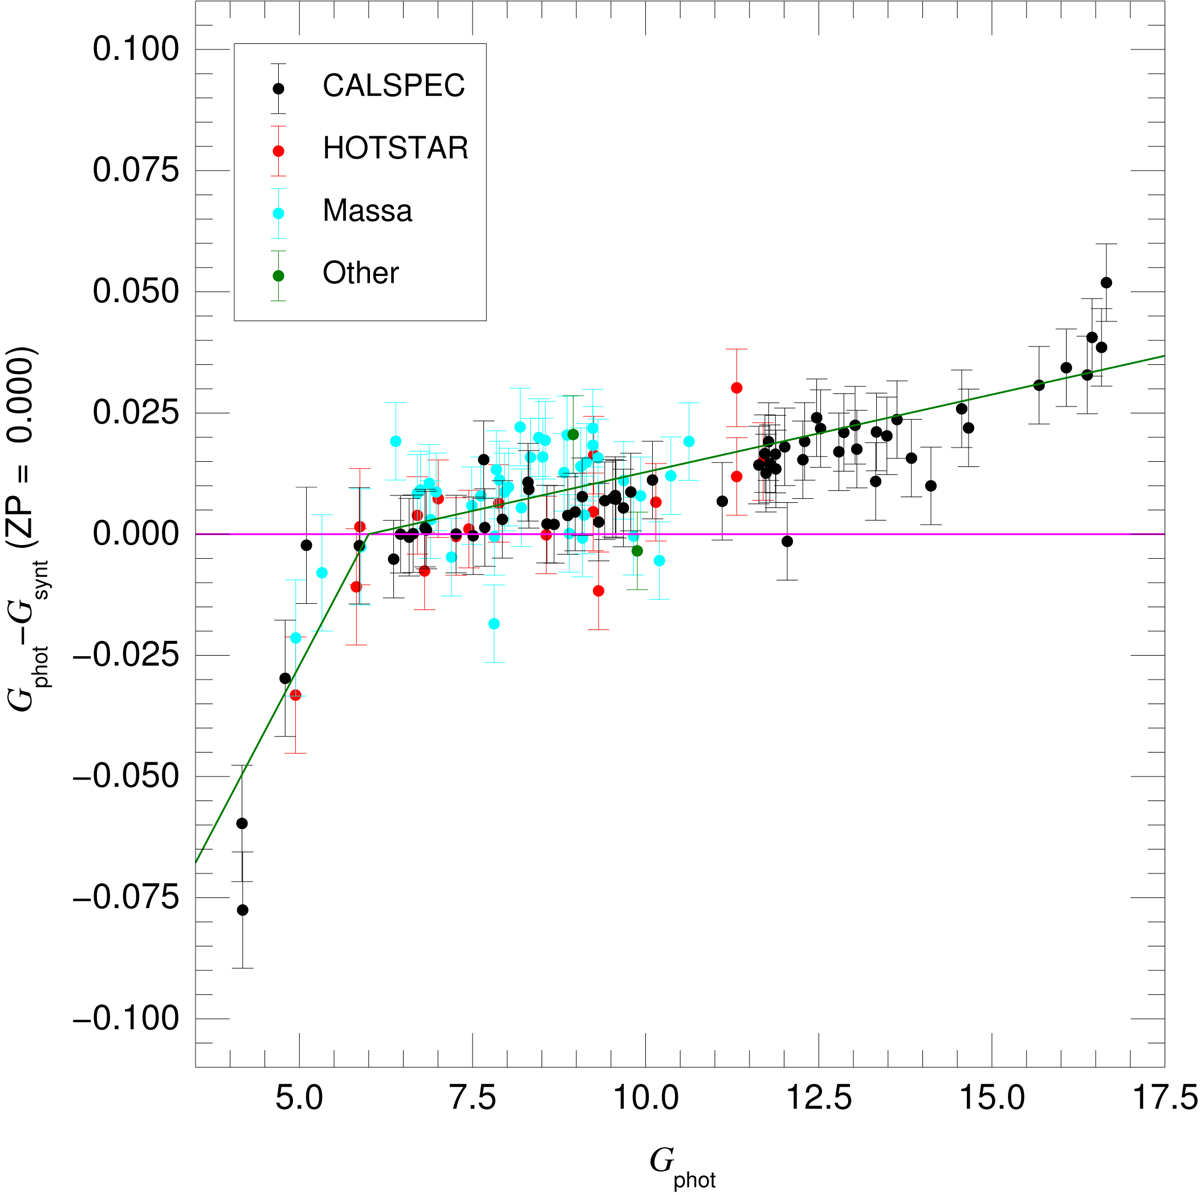
Correction of the systematic errors in G. The horizontal axis is the observed (uncorrected) G magnitude and the vertical axis is the difference between that value and the synthetic G magnitude assuming the G sensitivity curve in this paper and a ZP of 0. The points with error bars show the data, color-coded according to data set, and the dark green solid line shows the fit used to derive the correction proposed in this paper. The size of the error bars is explained in Sect. 4.
Current usage metrics show cumulative count of Article Views (full-text article views including HTML views, PDF and ePub downloads, according to the available data) and Abstracts Views on Vision4Press platform.
Data correspond to usage on the plateform after 2015. The current usage metrics is available 48-96 hours after online publication and is updated daily on week days.
Initial download of the metrics may take a while.