Fig. 6.
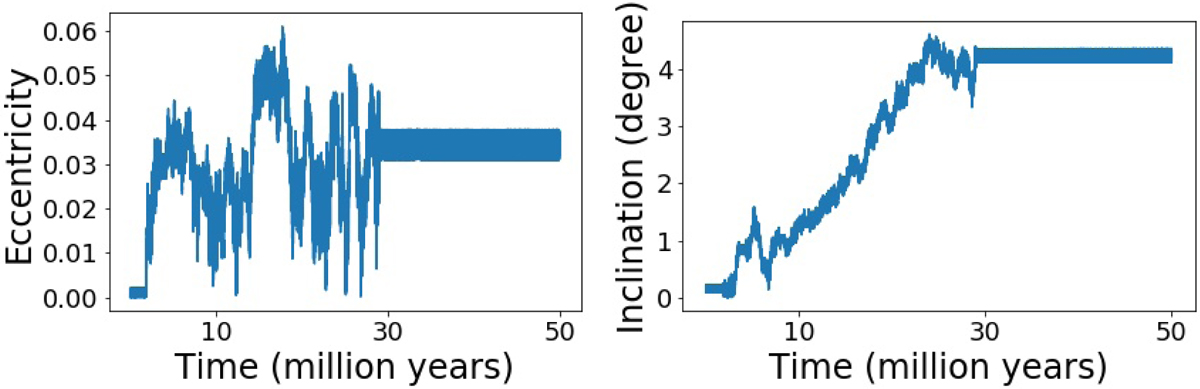
Example figures of outputs obtained from our simulations. In this example we clearly distinguish a regular evolution before the resonance, a chaotic resonance crossing, and finally regular dynamics after the resonance. In this specific example, the eccentricity increase is around 0.035 and the tilt has grown to around 4.5. These two figures were taken from a run of 100 simulations using the semi-analytic model with Q = 200.
Current usage metrics show cumulative count of Article Views (full-text article views including HTML views, PDF and ePub downloads, according to the available data) and Abstracts Views on Vision4Press platform.
Data correspond to usage on the plateform after 2015. The current usage metrics is available 48-96 hours after online publication and is updated daily on week days.
Initial download of the metrics may take a while.