Fig. 8.
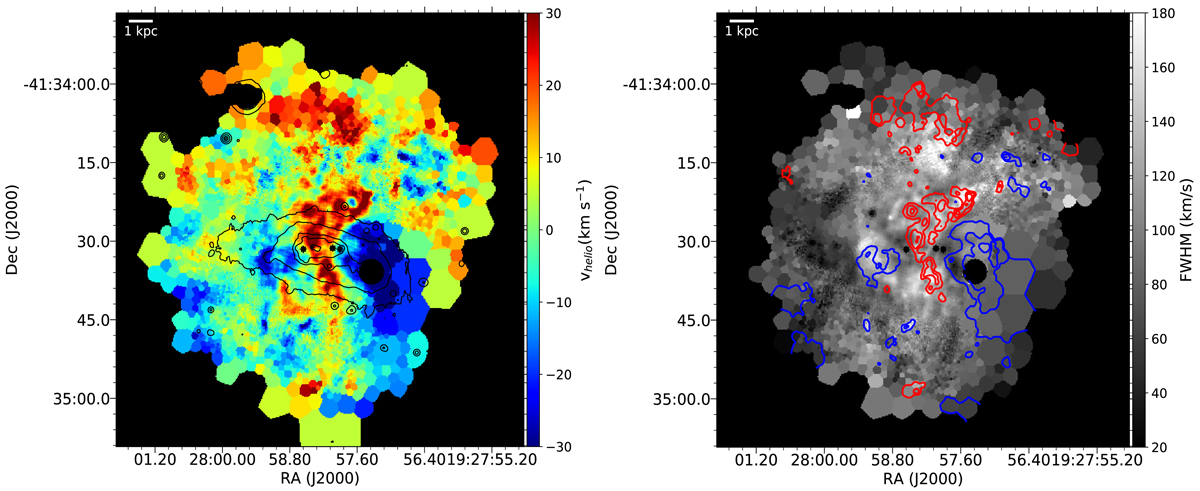
Kinematic information derived from a Gaussian fit to the Hα emission with the Hα velocity field (left panel). The black contours are the contours of the I-band image reconstructed from the MUSE cube. Right panel: FWHM map of the Hα line. The instrumental FWHM is quadratically subtracted. Over-plotted in blue and red contours are the blue (−50, −30, −15 km s−1) and red (15, 25, 35 km s−1) shifted velocity respectively.
Current usage metrics show cumulative count of Article Views (full-text article views including HTML views, PDF and ePub downloads, according to the available data) and Abstracts Views on Vision4Press platform.
Data correspond to usage on the plateform after 2015. The current usage metrics is available 48-96 hours after online publication and is updated daily on week days.
Initial download of the metrics may take a while.