Fig. 7.
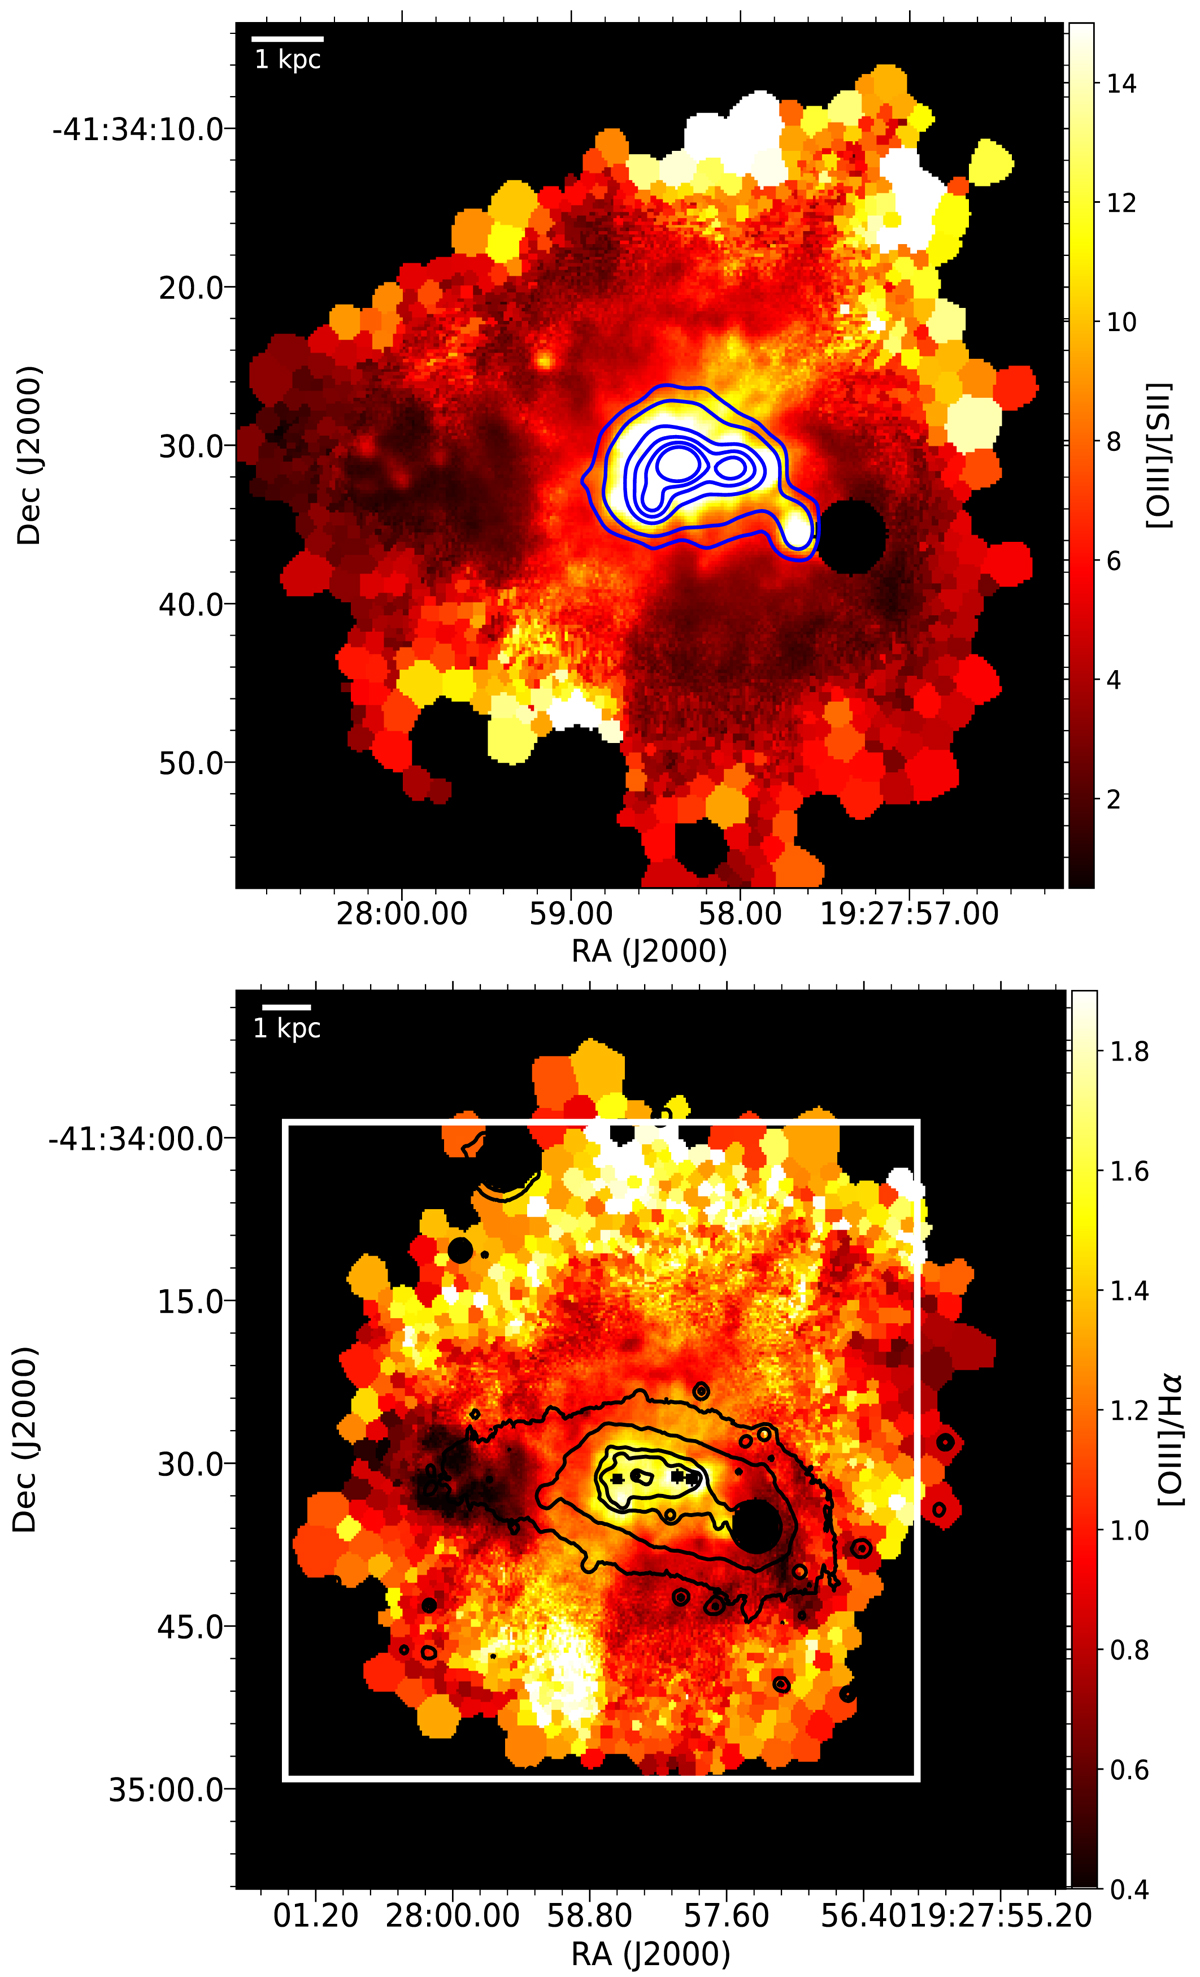
Ionization structure of the halo of ESO 338. Panel a: ionization parameter map of the central area of ESO 338 as traced by the [O III]λ 5007 Å/[S II] λ(6717 + 6731) Å line ratio. The blue contours show the He II λ4686 Å emission. The He II image was smoothed with 3 pixel Gaussian kernel. The contour levels range from 50 to 1300 × 10−20 erg s−1 cm−2. Panel b: ionization map as derived from the [O III]5007 Å over Hα line ratio. The black contours are the I-band contours similar to Fig. 4. The white box denotes the borders of the slightly zoomed in [O III]/[S II] ionization map in panel a and the extinction map in Fig. 5.
Current usage metrics show cumulative count of Article Views (full-text article views including HTML views, PDF and ePub downloads, according to the available data) and Abstracts Views on Vision4Press platform.
Data correspond to usage on the plateform after 2015. The current usage metrics is available 48-96 hours after online publication and is updated daily on week days.
Initial download of the metrics may take a while.