Fig. 5.
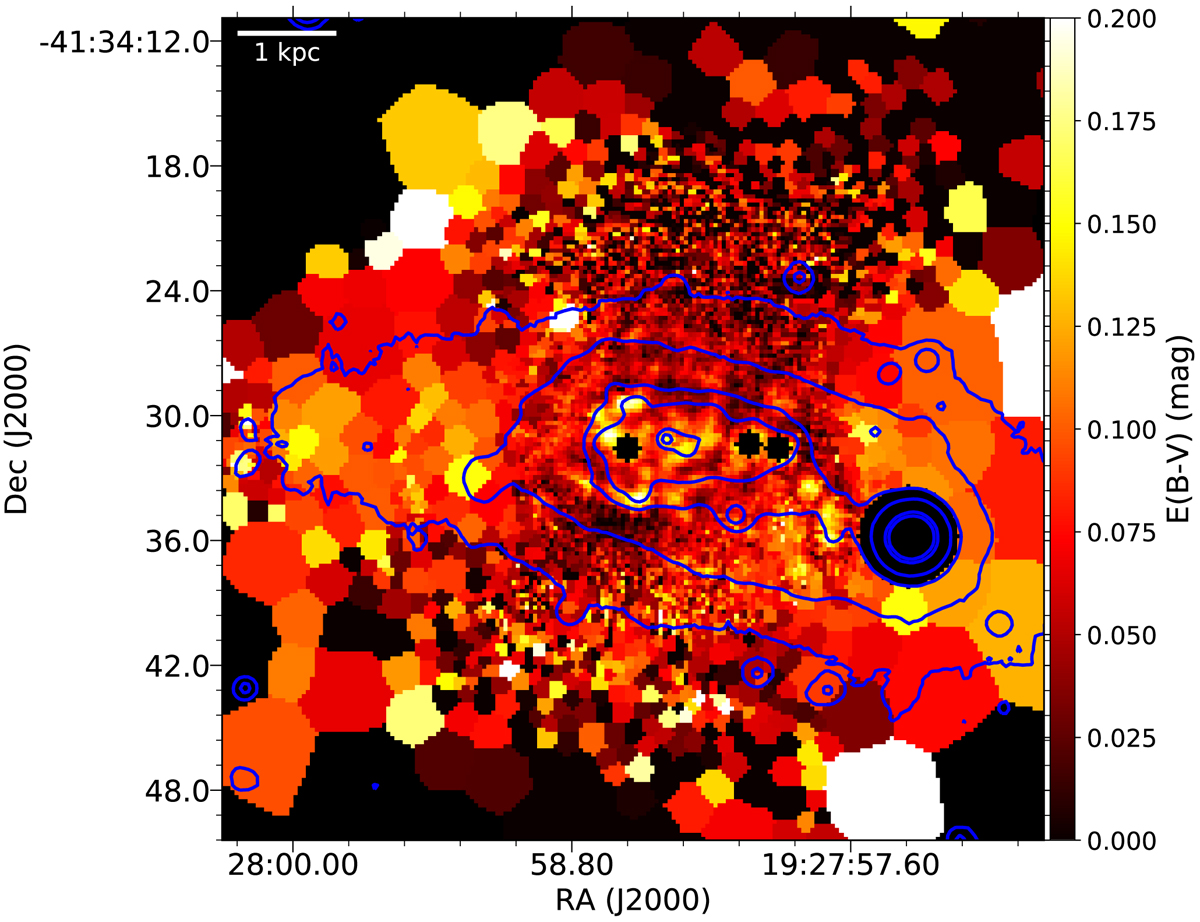
E(B – V) map towards ESO 338 derived from the Hα/Hβ ratio. Both lines are corrected for underlying absorption of the stellar population. The extinction law of Prevot et al. (1984) is used and the plotted E(B – V) is corrected for the galactic foreground extinction. The blue contours are the contours of the I-band image reconstructed from the MUSE cube (identical to the black contours in Fig. 4). The saturated parts of the Hα image in the centre as well as the two bright foreground stars are masked out and appear as black. The high E(B – V) values at the outskirts are cells with relatively low S/N. The figure is zoomed in with respect of Fig. 4.
Current usage metrics show cumulative count of Article Views (full-text article views including HTML views, PDF and ePub downloads, according to the available data) and Abstracts Views on Vision4Press platform.
Data correspond to usage on the plateform after 2015. The current usage metrics is available 48-96 hours after online publication and is updated daily on week days.
Initial download of the metrics may take a while.