Fig. 4.
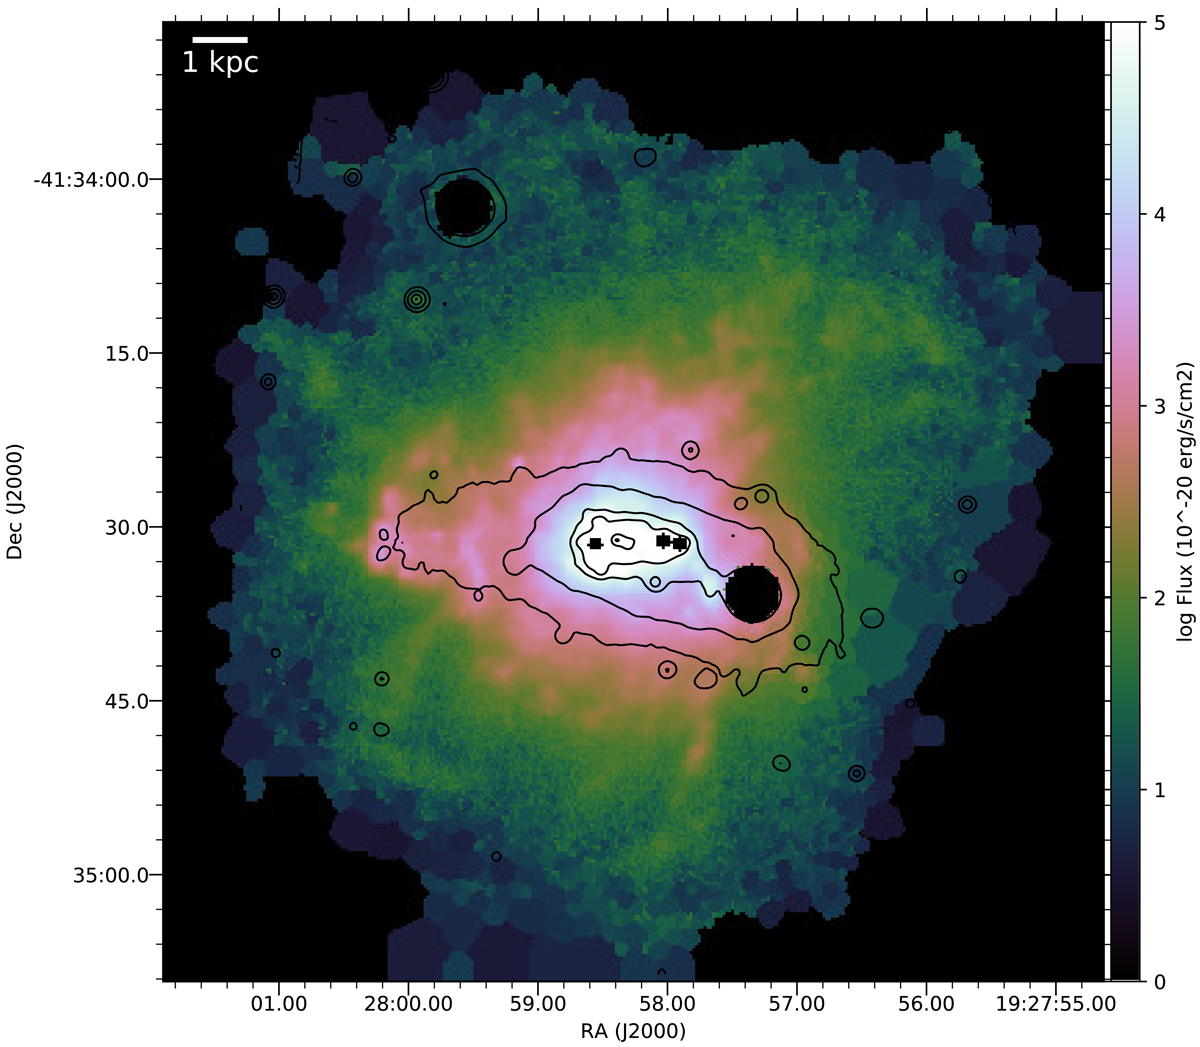
Logarithmic scaled Hα emission line map of ESO 338 showing the spatial extend of the ionized halo. A Voronoi binning with minimum S/N of 5 and maximum bin size of 900 pixels (∼6□″) was applied. The Voronoi cells which have lower S/N than 5 are removed and plotted as black. Plotted in black contours are the contours of the I-band image reconstructed from the MUSE cube. Contour levels are 15, 50, 100, 400, 700 and 1000 × 10−20 erg s cm−2 Å−1. The lowest contour corresponds to an AB I-band magnitude of 25.2 mag. The saturated parts of the Hα image in the centre as well as the two bright foreground stars are masked out and appear as black.
Current usage metrics show cumulative count of Article Views (full-text article views including HTML views, PDF and ePub downloads, according to the available data) and Abstracts Views on Vision4Press platform.
Data correspond to usage on the plateform after 2015. The current usage metrics is available 48-96 hours after online publication and is updated daily on week days.
Initial download of the metrics may take a while.