Free Access
Fig. 3.
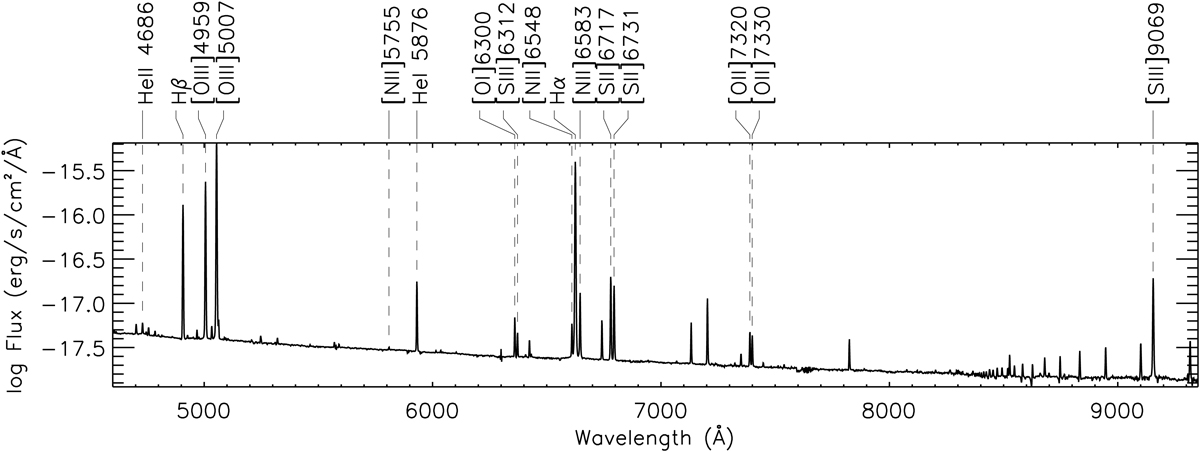
Integrated MUSE spectrum centred on cluster 23 (α = 19h27m58.429s, δ = −41°34′30.74″) extracted with an aperture of 3″, covering the central regions of ESO 338. The emission lines used in this paper are labelled in the spectrum. We note that this spectrum contains one of areas where [O III] and Hα are saturated.
Current usage metrics show cumulative count of Article Views (full-text article views including HTML views, PDF and ePub downloads, according to the available data) and Abstracts Views on Vision4Press platform.
Data correspond to usage on the plateform after 2015. The current usage metrics is available 48-96 hours after online publication and is updated daily on week days.
Initial download of the metrics may take a while.