Fig. 2.
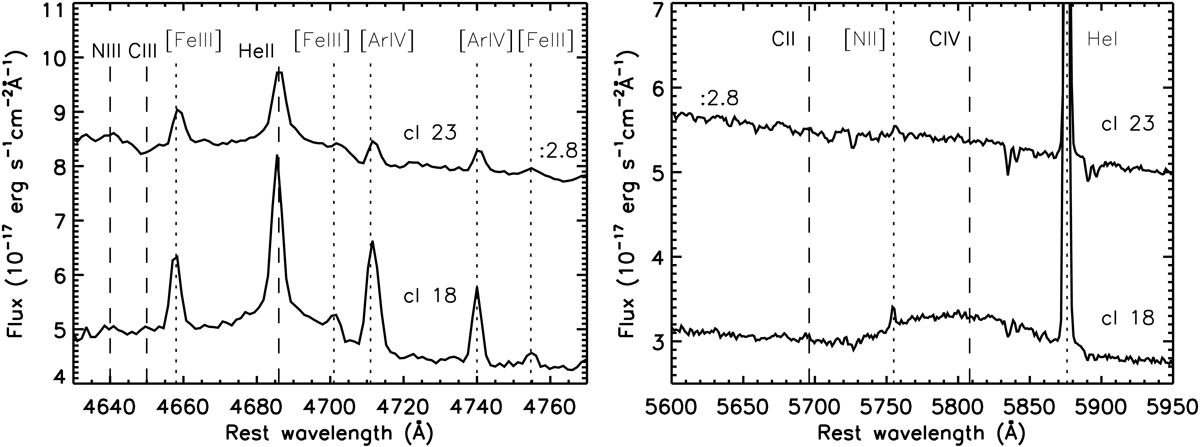
Spectra of cluster 23 (top) and cluster 18 (bottom) highlighting the WR features in their spectra. The spectrum of cluster 23 is scaled down with a factor 2.8 to fit in the same scale. Left panel: spectral region around the He II 4686 Å line. The broad emission component is the signature of the presence of WR stars, the other WR lines (N III and C III) are not detected. The narrow component of He II is originating in the diffuse gas. Additionally, all the nebular emission lines are marked. Right panel: spectral region around the red WR bump. This emission bump is originated by C IV, tracing WC stars. Cluster 23 only shows a faint bump, while cluster 18 shows a very strong feature.
Current usage metrics show cumulative count of Article Views (full-text article views including HTML views, PDF and ePub downloads, according to the available data) and Abstracts Views on Vision4Press platform.
Data correspond to usage on the plateform after 2015. The current usage metrics is available 48-96 hours after online publication and is updated daily on week days.
Initial download of the metrics may take a while.