Fig. 14.
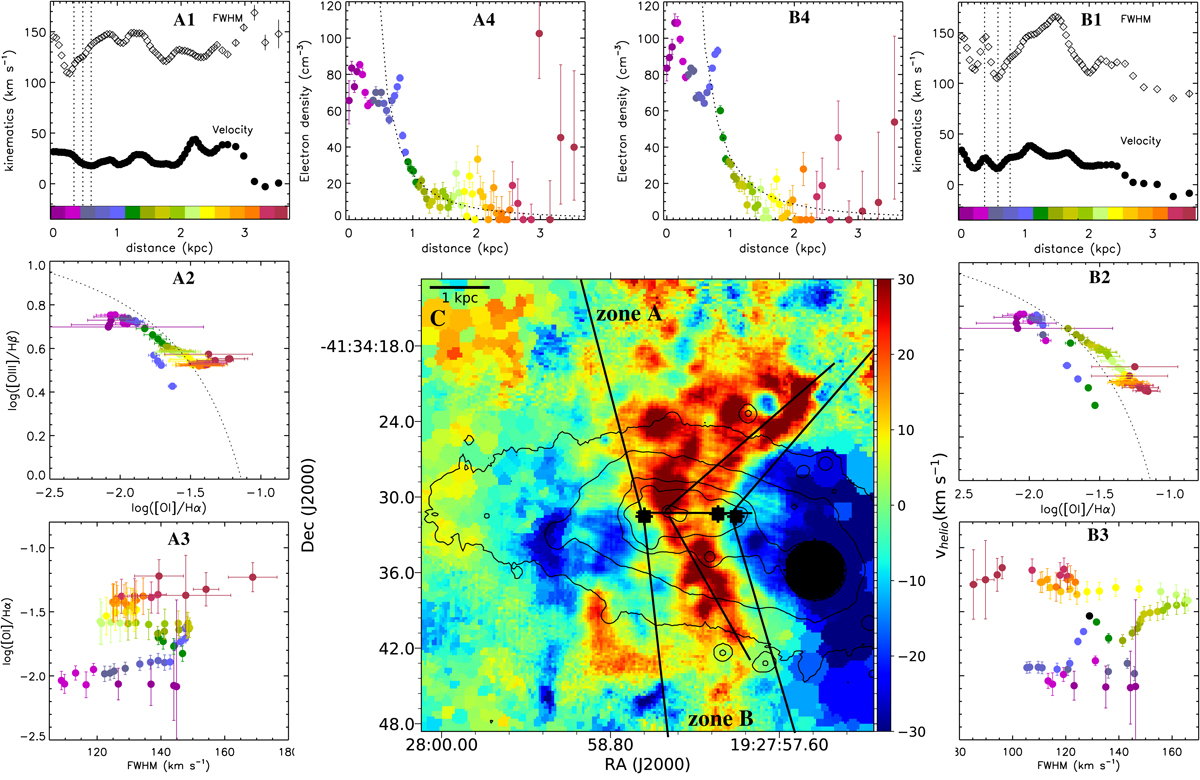
Derived outflow properties. Panel C: zoomed-in Hα velocity map, where we have outlined the northern (panel A) and southern (panel B) outflow zones in which we derive the outflow properties. Additionally, two lines (with a length of 3.5 kpc each) are plotted from which we calculated an artificial long slit spectrum (5 pixels wide) in order to plot the kinematic information. Panels A1 –A4: extracted information for the northern outflow, and panels B1 –B4: information for the southern outflow. Panels A1 and B1: kinematic information (top FWHM, bottom velocity) extracted from the long slits as a function of distance from cluster 23. The colour bars at the bottom give the relation between colour and distance used in the remaining diagrams. The vertical dotted lines mark the positions of the extracted FLAMES Hα profiles (Fig. 15). Panels A2 and B2: BPT diagram log[O I]/Hα vs. log[O III]/Hβ, with the ratios as a function of radius derived from the radial profiles of these lines. Panels A3 and B3: log [O I]/Hα ratio vs. FWHM as a function of radius (colour-coded). Panels A4 and B4: radial density profile derived from the [S II] line ratio calculated using Pyneb. Over-plotted as dotted line is a r−2 power-law as predicted for galactic scale outflow (Chevalier & Clegg 1985).
Current usage metrics show cumulative count of Article Views (full-text article views including HTML views, PDF and ePub downloads, according to the available data) and Abstracts Views on Vision4Press platform.
Data correspond to usage on the plateform after 2015. The current usage metrics is available 48-96 hours after online publication and is updated daily on week days.
Initial download of the metrics may take a while.