Fig. 13.
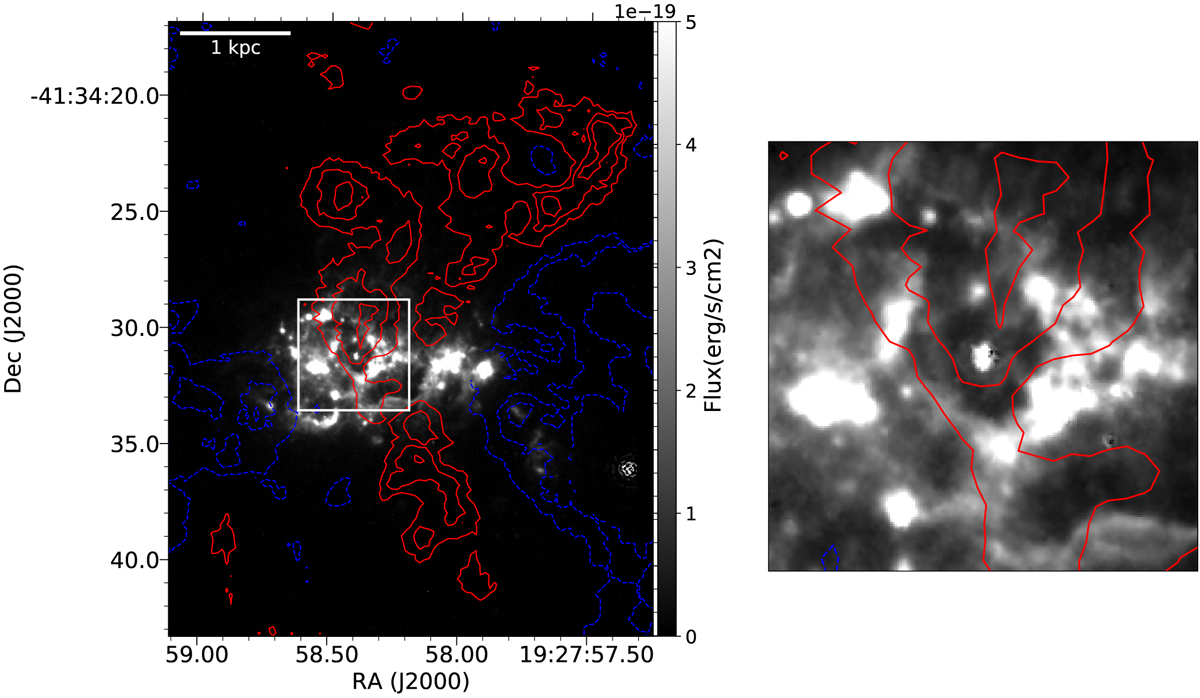
HST continuum corrected Hα image taken from Östlin et al. (2009), with the red shifted and blue shifted MUSE Hα velocity map overlayed as contours (Fig. 8). The red contours show the velocity contours of 20, 30 and 40 km s−1, while the blue contours show the velocities −10, −20 and −30 km s−1. The zoom in shows the central 1□ kpc around cluster 23. The HST map shows the bubble around cluster 23 and the hole in that bubble towards the north.
Current usage metrics show cumulative count of Article Views (full-text article views including HTML views, PDF and ePub downloads, according to the available data) and Abstracts Views on Vision4Press platform.
Data correspond to usage on the plateform after 2015. The current usage metrics is available 48-96 hours after online publication and is updated daily on week days.
Initial download of the metrics may take a while.