Fig. 12.
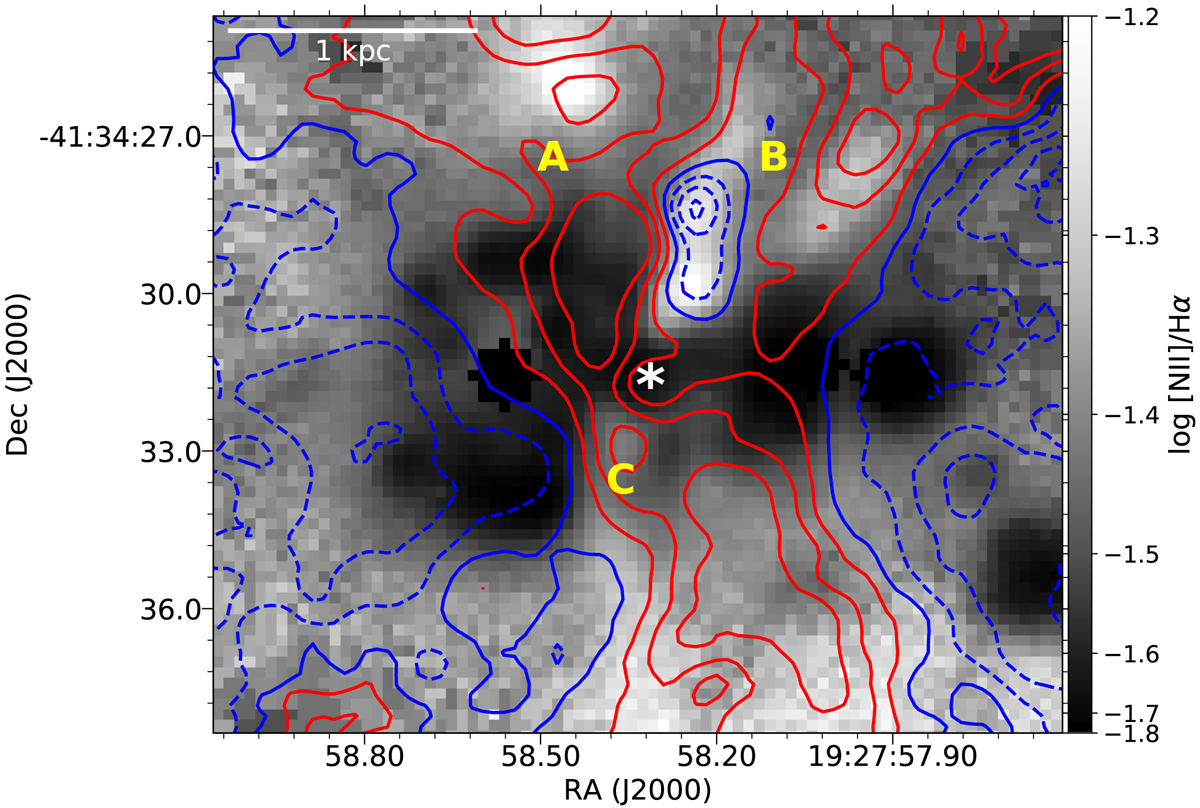
Map of the log([N II]/Hα) ratio in the central areas of ESO 338, highlighting the features showing the increase in the [N II]/Hα ratio. A v-shaped feature (B) as well as a circular blob (A) are seen north of the starburst clusters, while a fainter elongated feature (C) can be seen extending to the south. Overlayed in blue (−30, −20, −10, 0 km s−1) and red (10, 20, 30 km s−1) contours is the velocity field of the [N II] 6583 Å line. The eastern leg of feature B shows a strong blue shifted emission, which is not seen in Hα. The white asterisk is the possible location of the responsible cluster for the nitrogen enrichment.
Current usage metrics show cumulative count of Article Views (full-text article views including HTML views, PDF and ePub downloads, according to the available data) and Abstracts Views on Vision4Press platform.
Data correspond to usage on the plateform after 2015. The current usage metrics is available 48-96 hours after online publication and is updated daily on week days.
Initial download of the metrics may take a while.