Fig. 11.
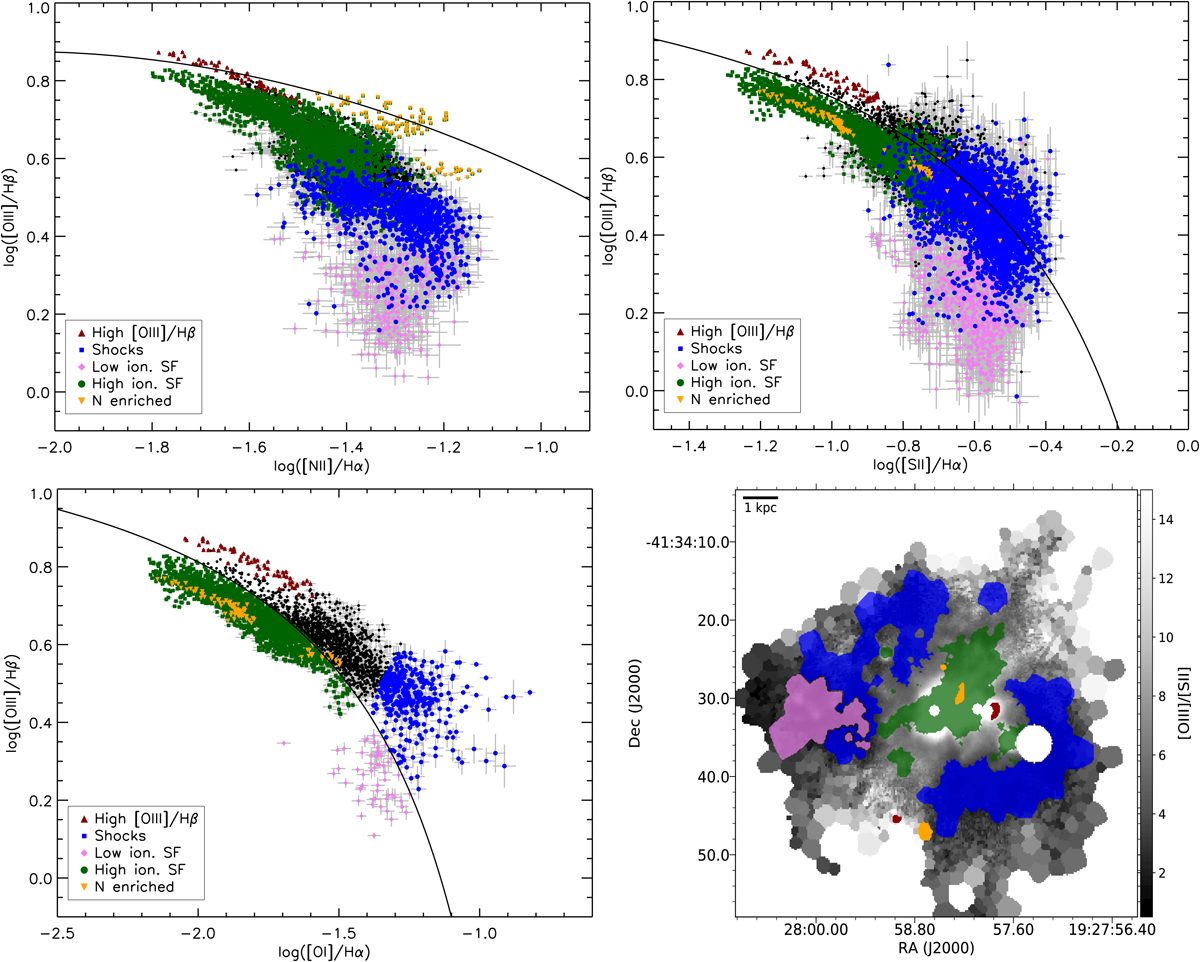
Spatially resolved BPT diagrams of ESO 338 (see Fig. 10). The different colours represent different selections made in the BPT diagrams. Red: data points with a very high [O III]/Hβ ratio, selected in the SII diagram as being above the star formation line, but not originating in shocks log([S II]/Hα) < −0.8. Green: high ionization (log([O III]/Hβ) > 0.4), star formation dominated gas (selected in the [O I] diagram). Blue: data points which cover the same area in the [O I] diagram as the shock models of Allen et al. (2008) and are located above the star formation line. Pink: low-ionization (log([O III]/Hβ) < 0.4), star formation dominated gas selected in the [O I] diagram. Orange: nitrogen enhanced gas detected as high [N II]/Hα ratio in the [N II] diagram. Black: data points which do not fulfil any of the selection criteria. Bottom right panel: in greyscale the [O III]/[S II] line ratio, tracing the ionization (Fig. 7) with over-plottted the location of the different selections made in the BPT diagrams.
Current usage metrics show cumulative count of Article Views (full-text article views including HTML views, PDF and ePub downloads, according to the available data) and Abstracts Views on Vision4Press platform.
Data correspond to usage on the plateform after 2015. The current usage metrics is available 48-96 hours after online publication and is updated daily on week days.
Initial download of the metrics may take a while.