Fig. 10.
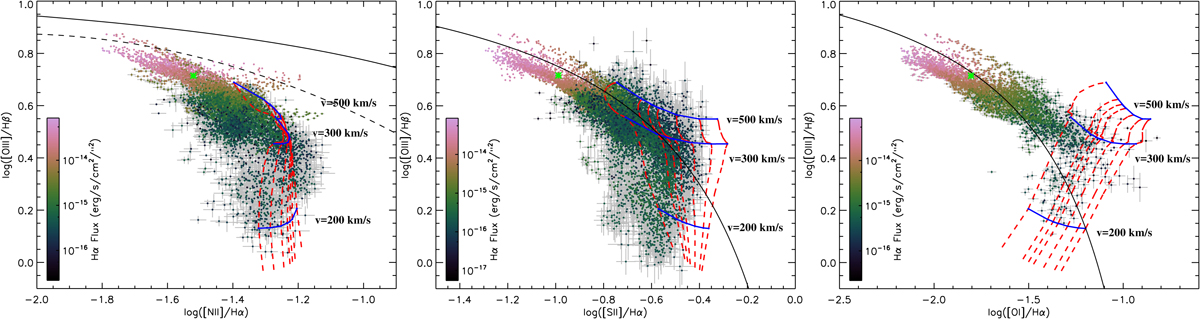
Spatially resolved BPT diagrams of the ionized gas around ESO 338. Left panel: “classic” BPT diagram [N II]6583 Å/Hα vs. [O III]/Hβ (Baldwin et al. 1981), middle panel: [S II]/Hα vs. [O III]/Hβ diagram, and right panel: [O I]/Hα vs. [O III]/Hβ (Veilleux & Osterbrock 1987). The data points are colour-coded according to their Hα flux in a logarithmic scaling. The areas where the [O III] or Hα emission is saturated are excluded from the diagram. The green asterisk is the flux weighted average of all the data. The dashed line in the [N II] diagram shows the Stasinska et al. (2006) divisory line between star-forming galaxies and AGNs, while the solid line shows the divisory line from Kewley et al. (2001). In the two other diagrams the solid lines separate the star forming galaxies from AGNs according to Kewley et al. (2001). The red dashed (constant magnetic field) and blue solid (constant velocity) lines are predictions from fast radiative shock models by Allen et al. (2008), calculated for different magnetic field strength and shock velocity. Only the shock + precursor models with the SMC metallicity are plotted.
Current usage metrics show cumulative count of Article Views (full-text article views including HTML views, PDF and ePub downloads, according to the available data) and Abstracts Views on Vision4Press platform.
Data correspond to usage on the plateform after 2015. The current usage metrics is available 48-96 hours after online publication and is updated daily on week days.
Initial download of the metrics may take a while.