Fig. 1
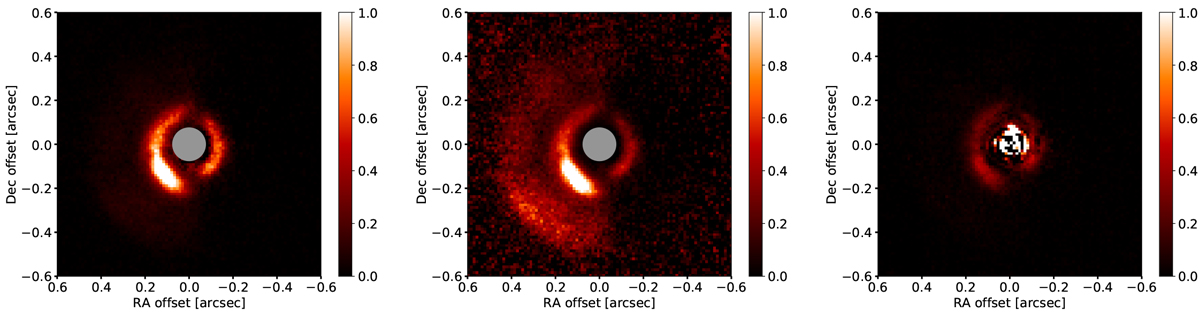
Left panel: J-band polarized intensity image Qϕ obtained with a coronagraph. The region masked by the coronagraph is indicated by the gray circle. Middle panel: same image but scaled by r2 to account for the drop-off in stellar illumination and enhance the visibility of faint outer disk features. Right panel: additional Qϕ image obtained without coronagraph. The innermost pixels (~60 mas) are saturated. The color scales are arbitrary. North is up, east points toward the left.
Current usage metrics show cumulative count of Article Views (full-text article views including HTML views, PDF and ePub downloads, according to the available data) and Abstracts Views on Vision4Press platform.
Data correspond to usage on the plateform after 2015. The current usage metrics is available 48-96 hours after online publication and is updated daily on week days.
Initial download of the metrics may take a while.