Free Access
Fig. 2.
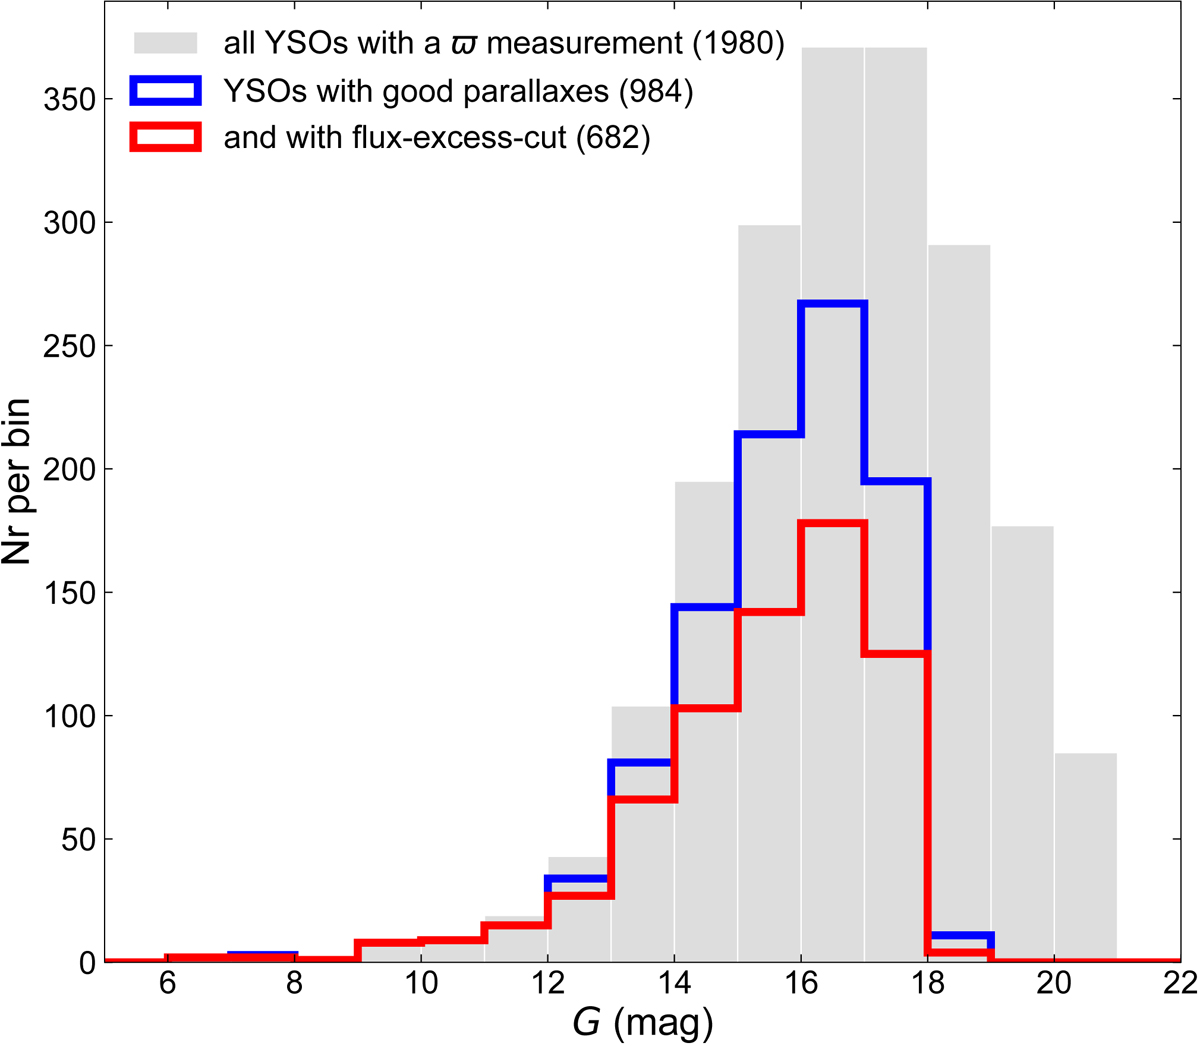
Histogram of Gaia DR2 G-band magnitudes. The gray distribution shows all YSOs toward Orion A with measured Gaia DR2 parallaxes. The red and blue distributions show the YSO samples that pass our required selection criteria, while we distinguish sources with (red) and without (blue) flux-excess-cut (see also Fig. 1).
Current usage metrics show cumulative count of Article Views (full-text article views including HTML views, PDF and ePub downloads, according to the available data) and Abstracts Views on Vision4Press platform.
Data correspond to usage on the plateform after 2015. The current usage metrics is available 48-96 hours after online publication and is updated daily on week days.
Initial download of the metrics may take a while.