| Issue |
A&A
Volume 619, November 2018
|
|
|---|---|---|
| Article Number | A176 | |
| Number of page(s) | 15 | |
| Section | Galactic structure, stellar clusters and populations | |
| DOI | https://doi.org/10.1051/0004-6361/201833888 | |
| Published online | 22 November 2018 | |
The chemical composition of the oldest nearby open cluster Ruprecht 147⋆
1 INAF-Osservatorio di Astrofisica e Scienza dello Spazio, Via P. Gobetti 93/3, 40129 Bologna, Italy
e-mail: This email address is being protected from spambots. You need JavaScript enabled to view it.
2 Department of Physics and Astronomy, Bologna University, Via P. Gobetti 93/2, 40129 Bologna, Italy
3 Fundación Galileo Galilei – INAF, Breña Baja, La Palma, Spain
4 INAF-Osservatorio Astronomico di Roma – Sede di Monteporzio Catone, Via di Frascati 33, 00040 Monte Porzio Catone, Italy
Received:
17
July
2018
Accepted:
9
September
2018
Abstract
Context. Ruprecht 147 (NGC 6774) is the closest old open cluster, with a distance of less than 300 pc and an age of about 2.5 Gyr. It is therefore well suited for testing stellar evolution models and for obtaining precise and detailed chemical abundance information.
Aims. We combined photometric and astrometric information coming from literature and the Gaia mission with very high-resolution optical spectra of stars in different evolutionary stages to derive the cluster distance, age, and detailed chemical composition.
Methods. We obtained spectra of six red giants using HARPS-N at the Telescopio Nazionale Galileo (TNG). We also used European Southern Observatory (ESO) archive spectra of 22 main sequence (MS) stars, observed with HARPS at the 3.6 m telescope. The very high resolution (115 000) and the large wavelength coverage (about 380–680 nm) of the twin instruments permitted us to derive atmospheric parameters, metallicity, and detailed chemical abundances of 23 species from all nucleosynthetic channels. We employed both equivalent widths and spectrum synthesis. We also re-derived the cluster distance and age using Gaia parallaxes, proper motions, and photometry in conjunction with the PARSEC stellar evolutionary models.
Results. We fully analysed those stars with radial velocity and proper motion/parallax in agreement with the cluster mean values. We also discarded one binary not previously recognised, and six stars near the MS turn-off because of their high rotation velocity. Our final sample consists of 21 stars (six giants and 15 MS stars). We measured metallicity (the cluster average [Fe/H] is +0.08, rms = 0.07) and abundances of light, α, Fe-peak, and neutron-capture elements. The Li abundance follows the expectations, showing a tight relation between temperature and abundance on the MS, at variance with M 67, and we did not detect any Li-rich giant.
Conclusions. We confirm that Rup 147 is the oldest nearby open cluster. This makes it very valuable to test detailed features of stellar evolutionary models.
Key words: stars: abundances / stars: evolution / open clusters and associations: general / open clusters and associations: individual: Ruprecht 147
All tables are also available at the CDS via anonymous ftp to cdsarc.u-strasbg.fr (130.79.128.5) or via http://cdsarc.u-strasbg.fr/viz-bin/qcat?J/A+A/619/A176
© ESO 2018
1. Introduction
The Gaia mission (Gaia Collaboration 2016a) with its legacy of astrometric and photometric data for more than 1.3 billion objects in the Milky Way and beyond is bringing us what is often referred to as a revolution in Galactic astrophysics. However, even if the Gaia Radial Velocity Spectrometer (RVS) will provide radial velocity for a few million stars (e.g. Katz et al. 2018; Marchetti et al. 2018) and chemical abundances for the brightest among them, the spectroscopic capabilities of Gaia are limited. This leaves space for complementary projects from the ground, such as for example the large spectroscopic surveys Gaia-ESO (Gilmore et al. 2012; Randich et al. 2013), GALAH (Martell et al. 2017) and others both on-going and future, and to smaller programmes concentrating on high precision velocities and detailed chemical composition. The synergy with Gaia will enhance results for all Galactic populations, in particular for the stellar clusters within the few kiloparsecs where the Gaia astrometry reaches the highest precision and high-resolution spectra of good quality are obtainable. This is the case for many open clusters (OCs) which can then be used to test the stellar evolutionary models on which, ultimately, age determinations are based; see for example a first application combining Gaia and Gaia-ESO in Randich et al. (2018). Furthermore, detailed abundances of elements of all nucleosynthetic chains in different evolutionary phases are important to test the “subtleties” of stellar models, such as diffusion and mixing (e.g. Önehag et al. 2014; Smiljanic et al. 2016; Bertelli Motta et al. 2018). Ruprecht 147, an old and very close OC, represents an ideal case for these studies.
Ruprecht 147 received very little attention until recently, despite being recognised as an old (age about 2.5–3 Gyr) and very close (175–300 pc) cluster in the Dias et al. (2002) and Kharchenko et al. (2005, 2013) catalogues. High-resolution spectra of three giant stars were obtained by Pakhomov et al. (2009), who derived atmospheric parameters, a metallicity slightly above solar ([Fe/H] = 0.11 ± 0.07 averaging the three stars), a mean radial velocity (RV) of 42.5 ± 3 km s−1, and abundances of many elements (light, α, Fe-peak, and n-capture). Spectra of eight giant stars were obtained by Carlberg (2014) to measure radial and rotation velocities; she derived a mean RV = 42.5 ± 1.0 km s−1 and found that five of the targets are good candidate members, based on their RV. Two of the stars have also been studied by Pakhomov et al. (2009) and four are in common with our sample; comparison of results will be presented below. Two stars in Rup 147 were studied by Brewer et al. (2016) among about 1600 F, G, and K stars observed in a search for planets. Spectra were obtained with Keck/HIRES and analysed using spectral synthesis, determining atmospheric parameters, projected rotational velocity, and abundances for 15 elements. The stars are CWW 21 = SPOCS 3038 and CWW 22 = SPOCS 3049, where SPOCS is the identification in Brewer et al. (2016), and they are not among our targets. They are solar-type stars, with [Fe/H] = +0.23.
The most relevant paper on this cluster is by Curtis et al. (2013). The authors, identifying its possible role as a “benchmark” cluster, given its proximity and old age, presented a comprehensive study of Rup 147, combining photometry, high-resolution spectroscopy, and literature astrometry. Curtis et al. (2013) selected possible astrometric members and conducted an RV survey with three different high-resolution spectrographs, finding about 100 candidate members and about 10 binaries or suspected binaries. The average RV for Rup 147 is 41.1 km s−1. They also collected higher-signal-to-noise (S/N) spectra of six stars, mostly in the main sequence (MS) evolutionary phase, which could be used for chemical analysis. On the basis of three of these stars, they derived an average [Fe/H] = 0.07 ± 0.03, in good agreement with the Pakhomov et al. (2009) result. Using deep CFHT/MegaCam photometry and different sets of stellar models they also studied the cluster colour-magnitude diagram (CMD) and deduced an age of about 2.5–3.0 Gyr and a distance of about 300 pc. We used information on membership based on Curtis et al. (2013) to select our targets (see following section).
The first Gaia data release (Gaia DR1; Gaia Collaboration 2016b) contained also the Tycho-Gaia astrometric solution (TGAS), that is, a subset of bright stars for which proper motions (PM) and parallaxes (ϖ) are derived using HIPPARCOS and Tycho-2 positions as first epoch. While Rup 147 is not among the 19 validation OCs studied by Gaia Collaboration (2017), data for many stars towards its position were available in TGAS. Cantat-Gaudin et al. (2018a) tried to characterise the open clusters in the solar neighbourhood (within 2 kpc) using TGAS parallaxes and PMs complemented by UCAC4 PMs and 2MASS photometry (Zacharias et al. 2012; Skrutskie et al. 2006). They found 63 astrometric members within a radius of 3 deg and determined the following average values: ϖ = 3.26 ± 0.09 mas, μα = −1.04 ± 0.18, and μδ = −26.85 ± 0.20 mas yr−1 (PMs come from UCAC4). They also determined age from isochrones for about one fifth of their 129 clusters, but unfortunately Rup 147 is not among them. Yen et al. (2018), combining information from all-sky ground-based photometry, TGAS, and HSOY (Altmann et al. 2017), derived fundamental parameters for 24 nearby OCs. For Rup 147 they found: ϖ = 3.53 ± 0.23 mas (i.e. distance 265 pc), μα = −1.48 ± 0.26, μδ = −26.92 ± 0.18 mas yr−1, E(B − V)=0.059, and an age of 725 Myr. They adopted PARSEC isochrones with solar metallicity (Bressan et al. 2012) for their analysis; their values for reddening and especially age are not consistent with literature values or with the findings in the present paper. They acknowledge the discrepancy, but do not give a fully convincing explanation. In fact, their procedure initially found a young age for the cluster (the one published), due to the inclusion of blue stragglers in the fit, which they try to manually exclude. However, they might have excluded too many stars close to the turn-off, resulting in an old age (about 6 Gyr). Ruprecht 147 is present in the second Gaia data release (Gaia DR2; Gaia Collaboration 2018b; Cantat-Gaudin et al. 2018b) and we used those ϖ and PM values in the present paper. Parameters based on Gaia DR2 astrometry and photometry were derived by one of the validation papers (Gaia Collaboration 2018a, see their Table 2, where the cluster is indicated by the alternate name of NGC 6774) using PARSEC isochrones and literature metallicity. They found distance modulus = 7.455, log(age) = 9.3, and E(B − V)=0.08, based on 154 candidate members. These values compare well with our findings (see Sect. 3); the age and reddening are slightly smaller, while the adopted metallicity, [Fe/H] = 0.16, is higher.
The paper is organised as follows: Sect. 2 describes the data, both proprietary and archival; Sect. 3 concerns cluster parameters derived using photometry and astrometry from Gaia; Sect. 4 deals with atmospheric parameters and chemical abundances; Sect. 5 presents a comparison with literature results; Sect. 6 discusses some elements in more details; and finally Sect. 7 summarises and puts our results in the context of our current understanding.
2. The data
We gathered spectra of six evolved stars of Rup 147, selected among the most probable single members according to Curtis et al. (2013). A log of the observations and of basic parameters taken from Gaia DR2 is given in Table A.1.
We used the very-high-resolution fibre High-Accuracy Radial velocity Planet Searcher in North hemisphere (HARPS-N) spectrograph, mounted at the Telescopio Nazionale Galileo (TNG) in La Palma, Canary Islands (programme A33DDT0). HARPS-N covers the spectral range 383–693 nm, with resolution R = 115 000. The spectra were reduced automatically using the Data Reduction Software (DRS) which supplies science-quality data. The basic processing steps comprise bias subtraction, spectrum extraction, flat fielding, and wavelength calibration. The spectra were corrected for barycentric motion.
Furthermore, we downloaded the ESO archive spectra of 22 MS stars obtained with HARPS at the ESO 3.6 m telescope to search for Neptune-size planets (original programmes 091.C-0471, 093.C-0540, and 095.C-0947). Also in this case, stars were selected among good candidate members from Curtis et al. (2013). These spectra are generally of low S/N (average value about 20) but there are several/many exposures for each star (from 2 to 58 individual spectra, with a mean of 15). Information on the archive stars based on Gaia DR2 is found in Table A.2. We downloaded the Advanced Data Products (ADP) spectra. The HARPS echelle data were reduced automatically using the DRS pipeline developed by the HARPS consortium, corrected for barycentric motion, and sky subtracted. The spectral coverage is essentially the same as HARPS-N, that is, 378–691 nm, and the resolution is also R = 115 000. The HARPS spectra were combined to enhance the S/N (see Table A.3) and the chemical analysis was done on the combined spectra.
We measured the RV on the individual spectra using iSpec (Blanco-Cuaresma et al. 2014b) and a line list; results and errors are given in Table A.3, where we show the average values for the MS stars. We also obtained vsin i, again using iSpec; most of the stars are slow rotators (see Table A.3). However, as shown in the right panel of Fig. 1, we eliminated the six stars closer to the MS turn-off (MSTO), because their rotation velocity makes their lines wider and more subject to blends.
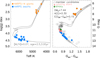 |
Fig. 1. Left-hand panel: Teff, log(g) diagram for the 21 stars analysed spectroscopically. Right-hand panel: CMD for Rup 147 based on Gaia DR2 photometry, with the stars fully analysed indicated by light blue filled squares (MS stars) and orange filled diamonds (giants). The stars with high rotation are indicated by pink filled triangles and the binary by a dark green plus symbol; stars considered members by Curtis et al. (2013) and candidate members based on Gaia astrometry and without HARPS/HARPS-N spectra are shown as empty black circles. In both panels we plot PARSEC isochrones for metallicity Z = 0.017 ([M/H] = 0.07), distance 308 pc (i.e. intrinsic distance modulus 7.44), and age 2.5 and 3.0 Gyr. A reddening E(GBP − GRP)=0.15 and an extinction on the GaiaG band A(G)=0.30 are applied to the isochrones in the CMD. |
The MS stars show generally a constant RV, however, we found two interesting cases among them: a) CWW 58 is clearly a binary, with an RV variation > 5 km s−1 in the 9 spectra obtained over a two-year interval; and b) CWW 71 shows a linear trend in its RV, which changes from 42.17 to 41.23 km s−1 for the 11 spectra, again obtained over approximately 2 years. Neither one was indicated as problematic in Curtis et al. (2013). We excluded star CWW 58 from further analysis but retained star 71. We have only one spectrum for the giants, so we cannot state that they are single stars; comparison with literature values cannot be conclusive because they are based on spectra of lower resolution and precision. Furthermore, systematics between the different analyses could hide small differences such as the ones we found for the two stars discussed above.
3. Cluster parameters
The stars observed are shown in Fig. 1 (right panel) in the CMD based on GaiaG band, BP and RP data. The targets were selected among high-probability members, based on RV and ground based proper motions (see Curtis et al. 2013, for details) and confirmed as members by Gaia DR2 PM, ϖ values a posteriori. The stars observed define the cluster sequence very well.
For this further assessment of their membership we downloaded ϖ and PM values for stars in a region of 80 arcmin in radius around the cluster centre. In Fig. 2 we show the proper motions for stars with G < 15 mag, colour-coded using the parallax; Rup 147 is well isolated from field stars. All stars in our spectroscopic sample are also included in Gaia DR2 (see Tables A.1 and A.2) and their mean ϖ (3.25 ± 0.09 mas) and PMs (PMα = −0.95 ± 0.78 mas yr−1, PMδ = −26.53 ± 0.65 mas yr−1) are in very good agreement with the cluster averages based on TGAS or DR2 (Cantat-Gaudin et al. 2018a,b) . All other stars that satisfy the Rup 147 parallax and PM are considered as member candidates (black circles in Fig. 1).
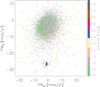 |
Fig. 2. Proper motion distribution for stars in a region of radius 80 arcmin around the nominal centre of Rup 147, coloured according to parallax (Gaia Collaboration 2018b). Candidate member stars in Rup 147 show a well clustered distribution roughly centred on PMα, PMδ ≈ −1, −26 and ϖ ≈ 3. |
The averages were computed as simple mean values, without taking into account the correlations between astrometric parameters, which do not have a relevant impact. Furthermore, we used the derived distance mainly to find good starting points for Teff and gravity for the spectroscopic analysis, in combination with the PARSEC isochrones (version 1.2S from CMD 3.0 web input form1, Bressan et al. 2012; Chen et al. 2014).
From the isochrone fit in Fig. 1 we estimate that Rup 147 is 2.5–3.0 Gyr old, adopting distance = 308 pc from Gaia DR2, which translates to (m − M)0 = 7.44, metallicity Z = 0.017 ([M/H] = 0.07, see Curtis et al. 2013), which is in good agreement with what we find (see Sect. 4), extinction E(GBP − GRP)=0.15, and absorption in the GaiaG band A(G)=0.30. By assuming a standard extinction law (RV=3.1, Cardelli et al. 1989) and taking A(G)=0.85926 A(V), A(GBP)=1.06794 A(V), A(GRP)=0.65199 A(V) from the PARSEC website, the reddening in (B − V) colour is E(B − V)=0.775 E(GBP − GRP)=0.113, and the extinction in V band is AV = 0.35, which is in between the values of 0.46 and 0.25 from Pakhomov et al. (2009) and Curtis et al. (2013), respectively. Further refinements are not required for the main goal of this paper, which focuses on the detailed chemical properties.
Adopting the Gaia DR2 parallax of the member candidates, we calculate the heliocentric Galactic coordinates of Rup 147: X = 280.21 ± 8.14 pc (towards the Galactic centre), Y = 106.90 ± 4.23 pc (towards the local direction of rotation in the Galactic plane), and Z = −70.00 ± 2.38 pc (towards the north Galactic pole). The Galactic radius of this cluster is RGC = 8.28 kpc. Its iron abundance ([Fe/H] = 0.08) is in good agreement with the expectations at its Galactocentric radius (see e.g. the homogeneous samples in Donati et al. 2015; Netopil et al. 2016; Reddy et al. 2016).
We then confirm once more that Rup 147 is the only old and nearby OC; next OC close-by and older than 1 Gyr is NGC 752 (age and distance about 1.6 Gyr and 450 pc, respectively) and we need to reach approximately 900 pc to find an OC older than Rup 147, that is M 67. Rup 147 is therefore very important as a benchmark cluster, as remarked by Curtis et al. (2013), and efforts to determine its detailed properties through photometry, astrometry, high-resolution spectroscopy, and modelling are welcome.
4. Atmospheric parameters and chemical abundances
To derive the atmospheric parameters we used the equivalent widths (EWs) of iron lines, both neutral and ionised, employing MOOG (Sneden 1973) via iSpec. Our analysis was done assuming local thermodynamic equilibrium (LTE) and using the MARCS model atmospheres (Gustafsson et al. 2008). We used the public Gaia-ESO line list (Heiter et al. 2015, and in prep.), which is based on VALD3 data (Ryabchikova et al. 2011), selecting only the Y/Y lines, that is, the most isolated ones with the most robust atomic data. We followed the classical spectroscopic method to derive temperature Teff, gravity logg, microturbulent velocity ξ, and the iron abundance [Fe/H]. Teff is obtained eliminating trends between the line abundances and the excitation potentials (excitation equilibrium), log(g) requiring that Fe I and Fe II give the same abundance (ionisation equilibrium), and ξ was obtained by minimising the slope of the relation between line abundances and EWs. The stellar parameters are given in Table A.3, together with the uncertainties, based on the uncertainties in the slopes of the three relations. With the Teff and log(g) values, we derive stellar mass from isochrones for our sample stars, the results are also listed in Table A.3.
We obtained an average [Fe/H] = 0.08 (rms 0.07) dex for Rup 147. If we divide the giants from the dwarfs to take into account possible (small) effects of diffusion (see e.g. Önehag et al. 2014; Bertelli Motta et al. 2018, both on M 67), we have [Fe/H] = 0.10 (rms 0.06) and 0.07 (rms 0.08) dex for the six giants and the 15 MS stars, respectively.
We derived the abundances of 23 species, including Li, light, α, Fe-peak, and neutron capture elements. We employed iSpec, again using the MOOG choice and the GES public line list, choosing Y/U lines. Given the (much) smaller number of lines available, we relaxed the criterium adopted for iron and also used lines for which blending had not been checked by the GES consortium; however, our spectra have a larger resolution and we inspected dubious cases. We employed spectrum synthesis for all lines, including hyper-fine structure (HFS). In Fig. 3 we show examples of the region near the Li I line for the 15 MS stars and near Na I for the 6 giants and the 6 MS stars excluded from further analysis because of their larger rotation velocity. We checked that the line list and the synthesis reproduced the solar abundances using the spectrum “HARPS.Archive_Sun-4” from the library of the Gaia FGK benchmark stars2 (Blanco-Cuaresma et al. 2014a). We found a difference for only three elements (Cu, Ba, and Eu), so we corrected the cluster abundances by these offsets based on our derived solar abundance. Finally, we visually checked a few lines in case of large dispersion in the line-by-line abundances.
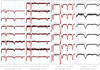 |
Fig. 3. A small spectral region close to the Li I 607.8 nm line for our 15 MS sample stars (first and second panels), and the spectral region close to the Na I 568.8 nm line for the 6 giant stars observed with HARPS-N (third panel). The vertical lines indicate all the Y/U lines we used in the analysis. We also show examples of synthetic spectrum fits for the 21 stars analysed (see text), while the 6 stars close to the MSTO excluded from analysis are shown separately (fourth panel). |
All abundances were obtained using LTE and are reported in Tables A.4–A.6. Oxygen was measured from the forbidden [O I] 630.3 nm line in the six giants, after making sure it was free from telluric contamination. The O triplet near 777 nm is not present in the HARPS wavelength range, so we did not measure O in the MS stars. For Li and Na we also corrected the LTE abundances with the prescription in Lind et al. (2009, 2011); we used the INSPECT web page3 deriving the non-LTE (NLTE) corrections line by line. In Table A.4 we give both LTE and NLTE abundances.
We derived the sensitivity to changes in stellar parameters by repeating the analysis for one typical giant and MS star, changing one parameter while holding the other fixed. Results are presented in Table A.7.
We show in Fig. 4 the run of [X/H] values with logg for all elements, with the exception of Li, which will be discussed in Sect. 6. We see that dwarfs and giants have slightly different levels in some cases. This is expected for Na (see e.g. Smiljanic et al. 2016, 2018, and Sect. 6) and can be explained for the other elements by the larger uncertainties associated to the analysis of the dwarfs (less and weaker lines) and by the systematic differences expected from their different atmospheres and sensitivity to details in the analysis (see e.g. Dutra-Ferreira et al. 2016 on the Hyades cluster). In principle, evolutionary differences may also be expected as a result of diffusion processes; they have been found for the older cluster M 67 (see Bertelli Motta et al. 2018; Souto et al. 2018; Gao et al. 2018, for Gaia-ESO, APOGEE, and GALAH results, respectively). However, the efficiency of the diffusion depends on the cluster age and we checked that only very small variations are expected for an age of 2.5–3 Gyr (less than ∼0.1 dex in most of the cases) using both PARSEC and MIST (Choi et al. 2016) stellar models.
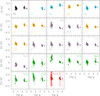 |
Fig. 4. Run of the derived elements ([X/H]) with gravity. Different colours indicate light, α, Fe-peak, n-capture (slow and rapid). Starred symbols indicate the mean values for dwarfs and giants (error bars are the standard deviation). |
We computed the average abundance ratios [X/Fe] for Rup 147, given in Table A.8, together with the root mean square (rms), both all together and separating dwarfs and giants. They were obtained adopting the reference solar values from Grevesse et al. (2007).
5. Literature comparison
We have only one star in common with Pakhomov et al. (2009), CWW 10/HD 180112, for which we have 4745 ± 33/2.38 ± 0.08/0.07 ± 0.11 for Teff, logg, and [Fe/H], compared to 4733/2.53/0.14 ± 0.06 (see Table A.9). Our average [Fe/H], based only on the giants for consistency with their work, is in perfect agreement: 0.10 ± 0.06 (six giants) compared to 0.11 ± 0.07 (three giants).
We have four stars in common with Carlberg (2014); the difference in RV is within 0.5 km s−1 and also the vsin i values are in agreement within the errors; see Table A.9.
Curtis et al. (2013) have the most complete analysis of Rup 147 to date. We agree with them on age (2.5–3 Gyr), distance (about 300 pc), and metallicity. For the last, their average is 0.07 ± 0.03, based on five MS stars observed with Keck/HIRES, while we have 0.07 ± 0.08 from 15 MS stars. We have two stars in common (CWW 78, 91, see Table A.9), their Teff and logg are larger in our study than in theirs, but the metallicities are in better agreement.
Curtis et al. (2018) studied star CWW 93 (hosting a sub-Neptune planet) in detail by means of photometry and spectroscopy and also obtained spectra of a further six solar-type stars in the cluster. All spectra were obtained with MIKE@Magellan and were analysed using SME (Spectroscopy Made Easy, Valenti & Piskunov 1996). For the seven solar-type stars they derived [Fe/H] = 0.10 ± 0.04, while the spectroscopically derived parameters for CWW 93 are Teff = 5697 K, log g = 4.453, [Fe/H] = 0.141, and vsin i = 1.95 km s−1.The mass and radius of the star were obtained combining spectroscopic results with photometry and the distance modulus in Curtis et al. (2013) and adopting three different isochrone sets and methods. The procedures gave consistent values and they adopted the mean values as final choice: mass = 1.009 ± 0.027 M⊙ and radius = 0.945 ± 0.027 R⊙. For comparison, for CWW 93 we obtain Teff = 5841 ± 57 K, logg = 4.53 ± 0.09, [Fe/H] = 0.18 ± 0.13, and vsin i = 1.21 ± 1.29 km s−1. The implied stellar mass for this star is 1.02 ± 0.01 M⊙.
Finally, Gaia DR2 contains the RV for 18 of the 21 stars in our final list, obtained by the Gaia RVS instrument (Cropper et al. 2018). The RVs are generally in agreement, especially when the error on the RVS measurements is small (see Table A.9). For all cases with a large difference, the RVS value has an error (much) larger than 1 km s−1, while all our errors are one order of magnitude smaller. The RV of the binary star CWW 58 is also similar between our measurements and Gaia’s (36.35, rms = 2.21 and 35.38 ± 2.06 km s−1, respectively); the Gaia pipelines did not detect this star as a possible binary. The validation of RVs for DR2 discards stars with very high errors (20 km s−1) or suspect SB2 systems (Katz et al. 2018) and they do not apply to star CWW 58. However, the Gaia RV is based only on two transits, so we believe that ours is a more robust indication.
6. Discussion
It has been found that Li abundance decreases as a function of age in solar twin stars and in open clusters (see e.g. Carlos et al. 2016; Castro et al. 2016, and references therein). However, age itself does not play a key role in this correlation, the genuine driver of the abundance dispersion is Li burning at the bottom of the surface convection zone, which could be indicated by Teff. For instance, Xiong & Deng (2009) point out that for stars with the same temperature (Teff ⪅ 6000 K), the Li abundance decreases as age increases. In Fig. 5 we compare the Li abundance of Rup 147 to that of two other open clusters with similar metallicity but different ages. Data for NGC 752 is from Castro et al. (2016) who provide [Fe/H] = 0.0 dex and an age of ∼1.6 Gyr. Lithium abundances in Castro et al. (2016) are originally given in LTE, but in Fig. 5 we applied NLTE corrections (Lind et al. 2009) to them considering a uniform microturbulence velocity ξ = 2 km s−1. This does not introduce spurious effects, since the NLTE correction for Li is not sensitive to microturbulence; for instance, using ξ = 1 km s−1 changes the final results by < 0.01 dex. In the figure, only stars marked as single are plotted. Lithium data on M 67 ([Fe/H] = 0.01, age = 3.7 Gyr) from Pace et al. (2012) are already NLTE-corrected. Since several works in the literature conclude that the Li abundance scatter in M 67 may be an exception for Li evolution in open clusters (see e.g. Sestito et al. 2004; Xiong & Deng 2009), we put the M 67 data in the figure only for reference. The left panel of Fig. 5 illustrates the Li evolution from the MS to the giant branch for the three clusters. Though the dwarf stars show a minor difference on Li, the giants stars of Rup 147 and NGC 752 have a very similar Li abundance level. Here we also notice that there is an un-reported Li-rich giant star (H 77) in NGC 752 with A(Li)NLTE = 1.60 dex. In the middle panel, Rup 147 shows a tight A(Li)–Teff relation for the MS stars (Teff from ∼5300 K to 6300 K); there is no large Li scatter as seen in M 67. This tight relation supports the conclusion of Sestito et al. (2004) that M 67 is the only cluster showing a large Li spread for solar-type stars, and the Li scatter is not typical of an old open cluster. Furthermore, all of the Rup 147 dwarf stars in our sample have Teff < 6300 K, which is around the Teff border of the Li-dip at solar metallicity (see NGC 752 in the middle panel of Fig. 5). Considering that the turn-off Teff of Rup 147 is ⪅6400 K (see the HR diagram in Fig. 1), one can very hardly expect a dip-like pattern in the Li-Teff figure of Rup 147 even if more turn-off stars are observed in the future.
Compared to the MS stars of NGC 752, which is 1 Gyr younger, Rup 147 dwarfs present a lower Li abundance at the same temperature. The age difference on Li abundance is also seen in the right panel of Fig. 5; with the same stellar mass, Rup 147 MS stars (M < 1.3 M⊙) have lower Li abundance compared to NGC 752 dwarfs, a difference mostly caused by microscopic diffusion. However, the stellar mass was derived using different stellar models for each cluster, and this may introduce some systematic uncertainty.
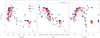 |
Fig. 5. Li evolution as a function of log(g) (left panel), Teff (middle panel), and stellar mass (right panel). Three clusters with similar metallicity but different ages are displayed. The red-filled dots are our Rup 147 (2.5–3.0 Gyr) sample stars with NLTE correction, the blue-filled squares are NLTE-corrected NGC 752 (∼1.6 Gyr) single stars originally from Castro et al. (2016), and the grey-filled diamonds are Li-corrected M 67 (∼3.7 Gyr) data from Pace et al. (2012). The Li abundance derived from chondrite meteorites (A(Li)=3.25 dex, Grevesse et al. 2007) is indicated by a dashed line. |
The average [Na/Fe] value for MS stars is 0.08 dex, while for giants this is 0.24 dex. This enhancement for giants is not uncommon among OCs (see e.g. MacLean et al. 2015, for references) but is not universal (e.g. Sestito et al. 2008; Bragaglia et al. 2012, all for old OCs). After excluding cases due to neglecting NLTE effects, the enhancement may be attributed to mixing of Na to the stellar photosphere after the first dredge-up (Iben 1967). The amount of mixing is then dependent on the stellar mass (and metallicity), with low-mass, low-metallicity stars showing no changes (see the observations by Gratton et al. 2000) and higher-mass stars showing increasing indications (see e.g. the models by Charbonnel & Lagarde 2010). The presence and extent of Na enhancement among OC giants has recently been studied systematically by Smiljanic et al. (2016, 2018), with comparison to various stellar models. For Rup 147, given the age, we should in principle not expect a large effect, but it seems on the contrary to show a higher Na enhancement than two OCs of similar age in the Gaia-ESO survey (see Fig. 6). However, our solar Na is 6.17 (Grevesse et al. 2007), while Smiljanic et al. (2016) use 6.30; had we used the latter, [Na/Fe] would be at the same level as the Gaia-ESO clusters (the solar reference iron is 7.45 for both samples).
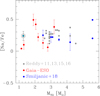 |
Fig. 6. Run of [Na/Fe] with mass at MSTO, where each point represents a cluster average, based only on evolved stars. Our determination for Rup 147 (average of the 6 giants) is shown as a filled light blue circle with error bars highlighted by a larger circle. We show literature values coming from three homogeneous groups: the Gaia-ESO survey clusters in Smiljanic et al. (2016), Overbeek et al. (2017) and Tang et al. (2017) are shown in red, the young clusters in Smiljanic et al. (2018) in blue, both with error bars, and clusters in Reddy et al. (2012, 2013, 2015, 2016) in grey. |
Apart from Li and Na, which are known to vary with evolutionary phase, how do other elements behave in comparison to other open clusters? We compare α and Fe-peak elements with the results of 11 OCs homogeneously analysed by the Gaia-ESO survey covering almost the whole interval in metallicity of OCs and with ages from 120 Myr to 4 Gyr, published in Magrini et al. (2017). Figure 7 shows that Rup 147 behaves well, with abundance ratios in line with clusters of similar metallicity. Only three species look slightly discrepant (O, Mg, and V), but the differences between Rup 147 and the Gaia-ESO results can be explained by the different solar reference values adopted (see figure caption).
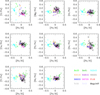 |
Fig. 7. Comparison of some of our abundance ratios (black crosses) with those of Gaia-ESO open clusters from Magrini et al. (2017), shown as open squares of different colours (see legend). For both samples we show the individual stars value, not cluster averages. The agreement is good, especially once differences in solar reference is taken into account (their solar O and Mg is higher by 0.12 dex and V lower by 0.11 dex). |
7. Summary and conclusions
We observed six evolved stars in the old, nearby cluster Rup 147 using HARPS-N at the TNG and retrieved spectra of 22 MS stars from the ESO HARPS archive. Our final sample comprises the six giants and 15 MS stars (one of the MS stars was excluded because we found it to be a binary, and six more because they rotate and display wide lines). We measured RVs, determined atmospheric parameters, and derived abundances for iron, light, α, iron-peak, and neutron-capture elements. Comparisons to extant measurements reveal general agreement. We did not find evidence of significant differences between dwarfs and giants, with two exceptions. Sodium is enhanced in giants with respect to MS stars, as expected from mixing mechanisms. Lithium shows a normal depletion pattern as a function of evolutionary phase; in particular Li and Teff follow a tight relation for MS stars, at variance with M 67, a cluster of similar age and metallicity, which shows an unusual (and maybe unique) dispersion in A(Li) at each Teff.
We reassessed the membership status of all our targets using Gaia parallaxes and proper motions. Combining Gaia photometry with distance, metallicity, Teff and logg values from our spectroscopic analysis, and PARSEC stellar models, for Rup 147 we derived distance, Galactic coordinates, reddening, and age. Ruprecht 147 has metallicity Z = 0.017 ([Fe/H] ≈ 0.08 dex), reddening E(GBP − GRP)=0.15 (i.e. E(B − V)=0.113), an age of 2.5–3 Gyr, a distance about 308 pc from the Sun and 8.28 kpc from the Galactic centre, and lies 0.07 kpc below the Galactic plane.
With the present paper we add another object to the short list of clusters for which both giants and dwarfs are analysed, an important test of consistency between the analysis of the different kinds of stars and of evolutionary processes affecting the surface abundances. However, existing spectroscopy is limited to the brighter part of the MS. Using Gaia data, Cantat-Gaudin et al. (2018b) found many more high-probability candidate members of Rup 147 on the single-star MS and on the well-separated binary sequence, down to the present limit for precise Gaia astrometry (G = 18). There is still room to improve the understanding of this important cluster and solidify its standing as a benchmark for stellar evolution studies.
Acknowledgments
This paper is based on observations made with the Italian Telescopio Nazionale Galileo (TNG) operated on the island of La Palma by the Fundación Galileo Galilei of the INAF (Istituto Nazionale di Astrofisica) at the Spanish Observatorio del Roque de los Muchachos of the Instituto de Astrofísica de Canarias. This paper is based on data obtained from the ESO Science Archive Facility under request number 299084. XF acknowledges funding by Premiale 2015 MITiC (PI B. Garilli) and the EU COST Action CA16117 (ChETEC). This work presents results from the European Space Agency (ESA) space mission Gaia. Gaia data are being processed by the Gaia Data Processing and Analysis Consortium (DPAC). Funding for the DPAC is provided by national institutions, in particular the institutions participating in the Gaia MultiLateral Agreement (MLA). The Gaia mission website is https://www.cosmos.esa.int/gaia. The Gaia archive website is https://archives.esac.esa.int/gaia. This research has made use of Vizier and SIMBAD, operated at CDS, Strasbourg, France, NASA’s Astrophysical Data System, and TOPCAT (http://www.starlink.ac.uk/topcat/, Taylor 2005). This research made use of the cross-match service provided by CDS, Strasbourg.
References
- Altmann, M., Roeser, S., Demleitner, M., Bastian, U., & Schilbach, E. 2017, A&A, 600, L4 [NASA ADS] [CrossRef] [EDP Sciences] [Google Scholar]
- Bertelli Motta, C., Pasquali, A., Richer, J., et al. 2018, MNRAS, 478, 425 [NASA ADS] [CrossRef] [Google Scholar]
- Blanco-Cuaresma, S., Soubiran, C., Jofré, P., & Heiter, U. 2014a, A&A, 566, A98 [NASA ADS] [CrossRef] [EDP Sciences] [Google Scholar]
- Blanco-Cuaresma, S., Soubiran, C., Heiter, U., & Jofré, P. 2014b, A&A, 569, A111 [NASA ADS] [CrossRef] [EDP Sciences] [Google Scholar]
- Bragaglia, A., Gratton, R. G., Carretta, E., et al. 2012, A&A, 548, A122 [NASA ADS] [CrossRef] [EDP Sciences] [Google Scholar]
- Bressan, A., Marigo, P., Girardi, L., et al. 2012, MNRAS, 427, 127 [NASA ADS] [CrossRef] [Google Scholar]
- Brewer, J. M., Fischer, D. A., Valenti, J. A., & Piskunov, N. 2016, ApJS, 225, 32 [NASA ADS] [CrossRef] [Google Scholar]
- Cantat-Gaudin, T., Vallenari, A., Sordo, R., et al. 2018a, A&A, 615, A49 [NASA ADS] [CrossRef] [EDP Sciences] [Google Scholar]
- Cantat-Gaudin, T., Jordi, C., Vallenari, A., et al. 2018b, A&A, 618, A93 [NASA ADS] [CrossRef] [EDP Sciences] [Google Scholar]
- Cardelli, J. A., Clayton, G. C., & Mathis, J. S. 1989, ApJ, 345, 245 [NASA ADS] [CrossRef] [Google Scholar]
- Carlberg, J. K. 2014, AJ, 147, 138 [NASA ADS] [CrossRef] [Google Scholar]
- Carlos, M., Nissen, P. E., & Meléndez, J. 2016, A&A, 587, A100 [NASA ADS] [CrossRef] [EDP Sciences] [Google Scholar]
- Castro, M., Duarte, T., Pace, G., & do Nascimento, J.-D. 2016, A&A, 590, A94 [NASA ADS] [CrossRef] [EDP Sciences] [Google Scholar]
- Charbonnel, C., & Lagarde, N. 2010, A&A, 522, A10 [NASA ADS] [CrossRef] [EDP Sciences] [MathSciNet] [PubMed] [Google Scholar]
- Chen, Y., Girardi, L., Bressan, A., et al. 2014, MNRAS, 444, 2525 [NASA ADS] [CrossRef] [Google Scholar]
- Choi, J., Dotter, A., Conroy, C., et al. 2016, ApJ, 823, 102 [NASA ADS] [CrossRef] [Google Scholar]
- Cropper, M., Katz, D., Sartoretti, P., et al. 2018, A&A, 616, A5 [NASA ADS] [CrossRef] [EDP Sciences] [Google Scholar]
- Curtis, J. L., Wolfgang, A., Wright, J. T., Brewer, J. M., & Johnson, J. A. 2013, AJ, 145, 134 [NASA ADS] [CrossRef] [Google Scholar]
- Curtis, J. L., Vandenburg, A., Torres, G., et al. 2018, AJ, 155, 173 [NASA ADS] [CrossRef] [Google Scholar]
- Dias, W. S., Alessi, B. S., Moitinho, A., & Lépine, J. R. D. 2002, A&A, 389, 871 [NASA ADS] [CrossRef] [EDP Sciences] [Google Scholar]
- Donati, P., Bragaglia, A., Carretta, E., et al. 2015, MNRAS, 453, 4185 [NASA ADS] [CrossRef] [Google Scholar]
- Dutra-Ferreira, L., Pasquini, L., Smiljanic, R., Porto de Mello, G. F., & Steffen, M. 2016, A&A, 585, A75 [NASA ADS] [CrossRef] [EDP Sciences] [Google Scholar]
- Gaia Collaboration (Brown, A. G. A., et al.) 2016a, A&A, 595, A2 [NASA ADS] [CrossRef] [EDP Sciences] [Google Scholar]
- Gaia Collaboration (Prusti, T., et al.) 2016b, A&A, 595, A1 [NASA ADS] [CrossRef] [EDP Sciences] [Google Scholar]
- Gaia Collaboration (van Leeuwen, F., et al.) 2017, A&A, 601, A19 [NASA ADS] [CrossRef] [EDP Sciences] [Google Scholar]
- Gaia Collaboration (Babusiaux, C., et al.) 2018a, A&A, 616, A10 [NASA ADS] [CrossRef] [EDP Sciences] [Google Scholar]
- Gaia Collaboration (Brown, A. G. A., et al.) 2018b, A&A, 616, A1 [NASA ADS] [CrossRef] [EDP Sciences] [Google Scholar]
- Gao, X., Lind, K., Amarsi, A. M., et al. 2018, MNRAS, 481, 2666 [NASA ADS] [CrossRef] [Google Scholar]
- Gilmore, G., Randich, S., Asplund, M., et al. 2012, The Messenger, 147, 25 [NASA ADS] [Google Scholar]
- Gratton, R. G., Sneden, C., Carretta, E., & Bragaglia, A. 2000, A&A, 354, 169 [NASA ADS] [Google Scholar]
- Grevesse, N., Asplund, M., & Sauval, A. J. 2007, Space Sci. Rev., 130, 105 [Google Scholar]
- Gustafsson, B., Edvardsson, B., Eriksson, K., et al. 2008, A&A, 486, 951 [NASA ADS] [CrossRef] [EDP Sciences] [Google Scholar]
- Heiter, U., Lind, K., Asplund, M., et al. 2015, Phys. Scr., 90, 054010 [Google Scholar]
- Iben, Jr., I. 1967, ARA&A, 5, 571 [NASA ADS] [CrossRef] [Google Scholar]
- Katz, D., Sartoretti, P., Cropper, M., et al. 2018, A&A, submitted [arXiv:1804.09372] [Google Scholar]
- Kharchenko, N. V., Piskunov, A. E., Röser, S., Schilbach, E., & Scholz, R.-D. 2005, A&A, 438, 1163 [NASA ADS] [CrossRef] [EDP Sciences] [MathSciNet] [Google Scholar]
- Kharchenko, N. V., Piskunov, A. E., Schilbach, E., Röser, S., & Scholz, R.-D. 2013, A&A, 558, A53 [NASA ADS] [CrossRef] [EDP Sciences] [Google Scholar]
- Lind, K., Asplund, M., & Barklem, P. S. 2009, A&A, 503, 541 [NASA ADS] [CrossRef] [EDP Sciences] [Google Scholar]
- Lind, K., Asplund, M., Barklem, P. S., & Belyaev, A. K. 2011, A&A, 528, A103 [NASA ADS] [CrossRef] [EDP Sciences] [Google Scholar]
- MacLean, B. T., De Silva, G. M., & Lattanzio, J. 2015, MNRAS, 446, 3556 [NASA ADS] [CrossRef] [Google Scholar]
- Magrini, L., Randich, S., Kordopatis, G., et al. 2017, A&A, 603, A2 [NASA ADS] [CrossRef] [EDP Sciences] [Google Scholar]
- Marchetti, T., Rossi, E. M., & Brown, A. G. A. 2018, MNRAS, in press [arXiv:1804.10607] [Google Scholar]
- Martell, S. L., Sharma, S., Buder, S., et al. 2017, MNRAS, 465, 3203 [NASA ADS] [CrossRef] [Google Scholar]
- Netopil, M., Paunzen, E., Heiter, U., & Soubiran, C. 2016, A&A, 585, A150 [NASA ADS] [CrossRef] [EDP Sciences] [Google Scholar]
- Nowak, G., Palle, E., Gandolfi, D., et al. 2017, AJ, 153, 131 [NASA ADS] [CrossRef] [Google Scholar]
- Önehag, A., Gustafsson, B., & Korn, A. 2014, A&A, 562, A102 [NASA ADS] [CrossRef] [EDP Sciences] [Google Scholar]
- Overbeek, J. C., Friel, E. D., Donati, P., et al. 2017, A&A, 598, A68 [NASA ADS] [CrossRef] [EDP Sciences] [Google Scholar]
- Pace, G., Castro, M., Melendez, J., Theado, S., & do Nascimento, Jr., J. D. 2012, A&A, 541, A150 [NASA ADS] [CrossRef] [EDP Sciences] [Google Scholar]
- Pakhomov, Y. V., Antipova, L. I., Boyarchuk, A. A., et al. 2009, Astron. Rep., 53, 660 [NASA ADS] [CrossRef] [Google Scholar]
- Randich, S., Gilmore, G., & Gaia-ESO Consortium 2013, The Messenger, 154, 47 [NASA ADS] [Google Scholar]
- Randich, S., Tognelli, E., Jackson, R., et al. 2018, A&A, 612, A99 [NASA ADS] [CrossRef] [EDP Sciences] [Google Scholar]
- Reddy, A. B. S., Giridhar, S., & Lambert, D. L. 2012, MNRAS, 419, 1350 [NASA ADS] [CrossRef] [Google Scholar]
- Reddy, A. B. S., Giridhar, S., & Lambert, D. L. 2013, MNRAS, 431, 3338 [NASA ADS] [CrossRef] [Google Scholar]
- Reddy, A. B. S., Giridhar, S., & Lambert, D. L. 2015, MNRAS, 450, 4301 [NASA ADS] [CrossRef] [Google Scholar]
- Reddy, A. B. S., Lambert, D. L., & Giridhar, S. 2016, MNRAS, 463, 4366 [NASA ADS] [CrossRef] [Google Scholar]
- Ryabchikova, T. A., Pakhomov, Y. V., & Piskunov, N. E. 2011, Kazan Izdatel Kazanskogo Univ., 153, 61 [Google Scholar]
- Sestito, P., Randich, S., & Pallavicini, R. 2004, A&A, 426, 809 [NASA ADS] [CrossRef] [EDP Sciences] [Google Scholar]
- Sestito, P., Bragaglia, A., Randich, S., et al. 2008, A&A, 488, 943 [NASA ADS] [CrossRef] [EDP Sciences] [Google Scholar]
- Skrutskie, M. F., Cutri, R. M., Stiening, R., et al. 2006, AJ, 131, 1163 [NASA ADS] [CrossRef] [Google Scholar]
- Smiljanic, R., Romano, D., Bragaglia, A., et al. 2016, A&A, 589, A115 [NASA ADS] [CrossRef] [EDP Sciences] [Google Scholar]
- Smiljanic, R., Donati, P., Bragaglia, A., Lemasle, B., & Romano, D. 2018, A&A, 616, A112 [NASA ADS] [CrossRef] [EDP Sciences] [Google Scholar]
- Sneden, C. A. 1973, PhD Thesis, The University of Texas at Austin, USA [Google Scholar]
- Souto, D., Cunha, K., Smith, V. V., et al. 2018, ApJ, 857, 14 [NASA ADS] [CrossRef] [Google Scholar]
- Tang, B., Geisler, D., Friel, E., et al. 2017, A&A, 601, A56 [NASA ADS] [CrossRef] [EDP Sciences] [Google Scholar]
- Taylor, M. B. 2005, Astron. Data Anal. Softw. Syst. XIV, 347, 29 [Google Scholar]
- Valenti, J. A., & Piskunov, N. 1996, A&AS, 118, 595 [NASA ADS] [CrossRef] [EDP Sciences] [Google Scholar]
- Xiong, D., & Deng, L. 2009, MNRAS, 385, 2013 [NASA ADS] [CrossRef] [Google Scholar]
- Yen, S. X., Reffert, S., Schilbach, E., et al. 2018, A&A, 615, A12 [NASA ADS] [CrossRef] [EDP Sciences] [Google Scholar]
- Zacharias, N., Finch, C. T., Girard, T. M., et al. 2012, VizieR Online Data Catalog: III/322 [Google Scholar]
Appendix A: Tables
Information for the six stars observed with HARPS-N.
Information for the stars in the ESO/HARPS archive.
Radial velocity, vsin i, atmospheric parameters, and isochrone-derived stellar mass.
Light and α-element abundances; the Sun is from Grevesse et al. (2007).
Iron peak element abundances; the Sun is from Grevesse et al. (2007).
Neutron-capture element abundances; the Sun is from Grevesse et al. (2007).
Sensitivity to errors in atmospheric parameters.
Average abundance ratios for giants, dwarfs, and entire sample.
Comparison with literature for RV and atmospheric parameters.
All Tables
Radial velocity, vsin i, atmospheric parameters, and isochrone-derived stellar mass.
All Figures
|
Fig. 1. Left-hand panel: Teff, log(g) diagram for the 21 stars analysed spectroscopically. Right-hand panel: CMD for Rup 147 based on Gaia DR2 photometry, with the stars fully analysed indicated by light blue filled squares (MS stars) and orange filled diamonds (giants). The stars with high rotation are indicated by pink filled triangles and the binary by a dark green plus symbol; stars considered members by Curtis et al. (2013) and candidate members based on Gaia astrometry and without HARPS/HARPS-N spectra are shown as empty black circles. In both panels we plot PARSEC isochrones for metallicity Z = 0.017 ([M/H] = 0.07), distance 308 pc (i.e. intrinsic distance modulus 7.44), and age 2.5 and 3.0 Gyr. A reddening E(GBP − GRP)=0.15 and an extinction on the GaiaG band A(G)=0.30 are applied to the isochrones in the CMD. |
| In the text | |
|
Fig. 2. Proper motion distribution for stars in a region of radius 80 arcmin around the nominal centre of Rup 147, coloured according to parallax (Gaia Collaboration 2018b). Candidate member stars in Rup 147 show a well clustered distribution roughly centred on PMα, PMδ ≈ −1, −26 and ϖ ≈ 3. |
| In the text | |
|
Fig. 3. A small spectral region close to the Li I 607.8 nm line for our 15 MS sample stars (first and second panels), and the spectral region close to the Na I 568.8 nm line for the 6 giant stars observed with HARPS-N (third panel). The vertical lines indicate all the Y/U lines we used in the analysis. We also show examples of synthetic spectrum fits for the 21 stars analysed (see text), while the 6 stars close to the MSTO excluded from analysis are shown separately (fourth panel). |
| In the text | |
|
Fig. 4. Run of the derived elements ([X/H]) with gravity. Different colours indicate light, α, Fe-peak, n-capture (slow and rapid). Starred symbols indicate the mean values for dwarfs and giants (error bars are the standard deviation). |
| In the text | |
|
Fig. 5. Li evolution as a function of log(g) (left panel), Teff (middle panel), and stellar mass (right panel). Three clusters with similar metallicity but different ages are displayed. The red-filled dots are our Rup 147 (2.5–3.0 Gyr) sample stars with NLTE correction, the blue-filled squares are NLTE-corrected NGC 752 (∼1.6 Gyr) single stars originally from Castro et al. (2016), and the grey-filled diamonds are Li-corrected M 67 (∼3.7 Gyr) data from Pace et al. (2012). The Li abundance derived from chondrite meteorites (A(Li)=3.25 dex, Grevesse et al. 2007) is indicated by a dashed line. |
| In the text | |
|
Fig. 6. Run of [Na/Fe] with mass at MSTO, where each point represents a cluster average, based only on evolved stars. Our determination for Rup 147 (average of the 6 giants) is shown as a filled light blue circle with error bars highlighted by a larger circle. We show literature values coming from three homogeneous groups: the Gaia-ESO survey clusters in Smiljanic et al. (2016), Overbeek et al. (2017) and Tang et al. (2017) are shown in red, the young clusters in Smiljanic et al. (2018) in blue, both with error bars, and clusters in Reddy et al. (2012, 2013, 2015, 2016) in grey. |
| In the text | |
|
Fig. 7. Comparison of some of our abundance ratios (black crosses) with those of Gaia-ESO open clusters from Magrini et al. (2017), shown as open squares of different colours (see legend). For both samples we show the individual stars value, not cluster averages. The agreement is good, especially once differences in solar reference is taken into account (their solar O and Mg is higher by 0.12 dex and V lower by 0.11 dex). |
| In the text | |
Current usage metrics show cumulative count of Article Views (full-text article views including HTML views, PDF and ePub downloads, according to the available data) and Abstracts Views on Vision4Press platform.
Data correspond to usage on the plateform after 2015. The current usage metrics is available 48-96 hours after online publication and is updated daily on week days.
Initial download of the metrics may take a while.