Fig. 3.
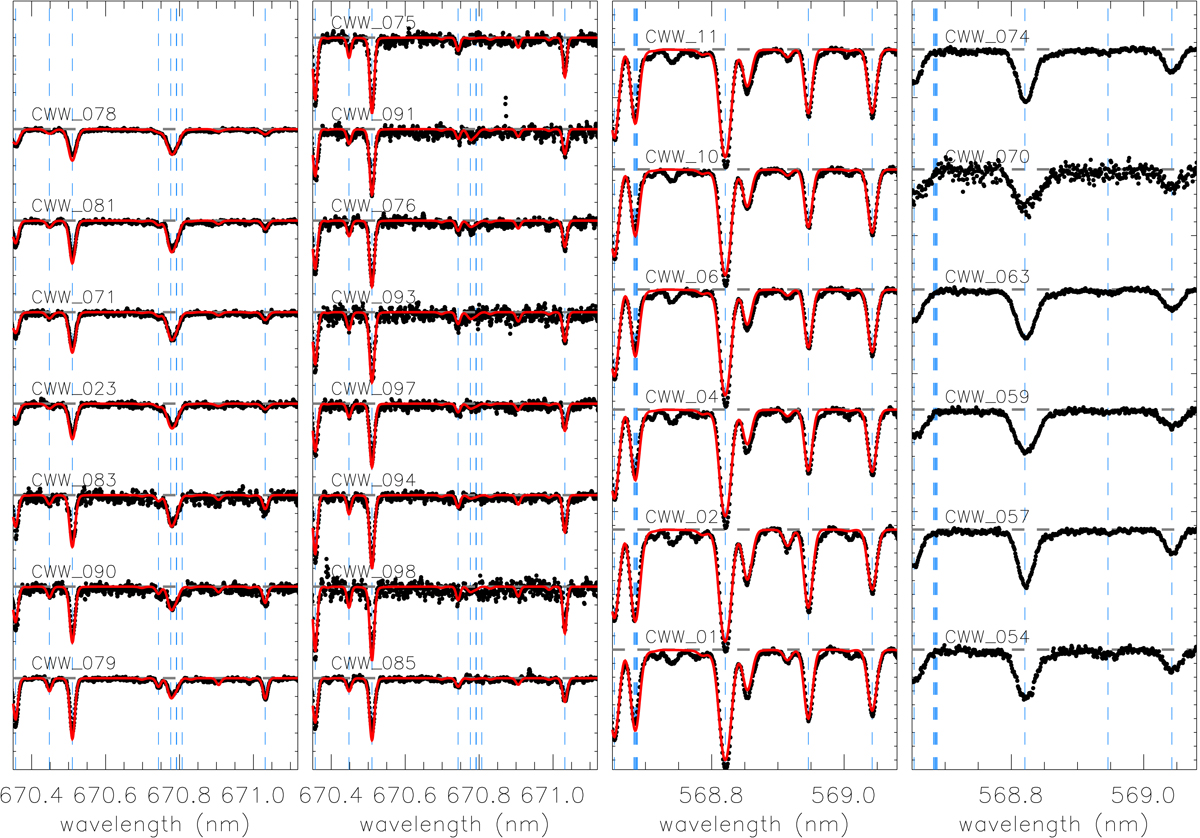
A small spectral region close to the Li I 607.8 nm line for our 15 MS sample stars (first and second panels), and the spectral region close to the Na I 568.8 nm line for the 6 giant stars observed with HARPS-N (third panel). The vertical lines indicate all the Y/U lines we used in the analysis. We also show examples of synthetic spectrum fits for the 21 stars analysed (see text), while the 6 stars close to the MSTO excluded from analysis are shown separately (fourth panel).
Current usage metrics show cumulative count of Article Views (full-text article views including HTML views, PDF and ePub downloads, according to the available data) and Abstracts Views on Vision4Press platform.
Data correspond to usage on the plateform after 2015. The current usage metrics is available 48-96 hours after online publication and is updated daily on week days.
Initial download of the metrics may take a while.