Fig. 4.
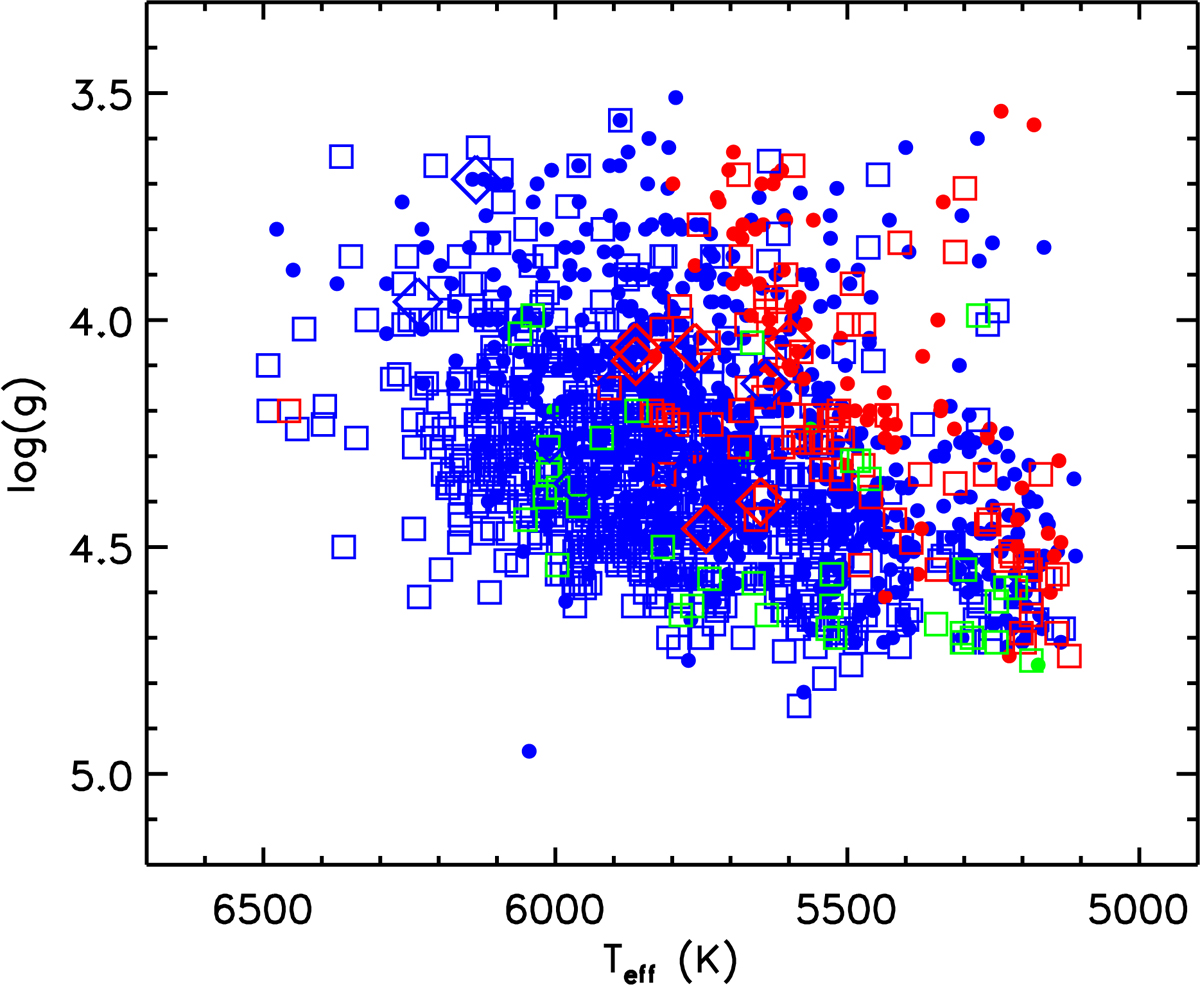
T eff vs. log(g) for the Ba sample. The thin disc (blue, 1476 stars), thick disc (red, 176 stars), and metal-rich α-rich (green, 42 stars) samples are shown. Different symbols are used for HARPS (•), FEROS (□), and UVES (⋄). We note that the coverage on this T eff vs. log(g) plane is similar to the Eu, Gd, and Dy sample, in addition to a different number of stars.
Current usage metrics show cumulative count of Article Views (full-text article views including HTML views, PDF and ePub downloads, according to the available data) and Abstracts Views on Vision4Press platform.
Data correspond to usage on the plateform after 2015. The current usage metrics is available 48-96 hours after online publication and is updated daily on week days.
Initial download of the metrics may take a while.