Free Access
Fig. 6.
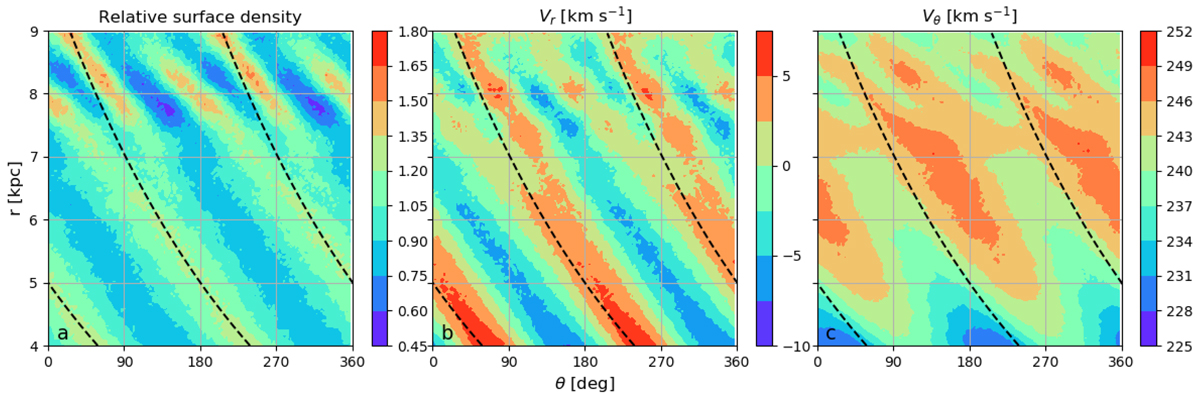
Maps of the best test-particle simulation, s2c, with Ωp = 20 km s−1 kpc−1 and A2 = 40 km2 s−2: Panel a: relative surface density (normalized to unity in azimuth). Panel b: Vr = −v (i.e., positive for motion toward GC), and Panel c: Vθ. The imposed spiral potential minima are indicated by dashed lines.
Current usage metrics show cumulative count of Article Views (full-text article views including HTML views, PDF and ePub downloads, according to the available data) and Abstracts Views on Vision4Press platform.
Data correspond to usage on the plateform after 2015. The current usage metrics is available 48-96 hours after online publication and is updated daily on week days.
Initial download of the metrics may take a while.