Fig. 15.
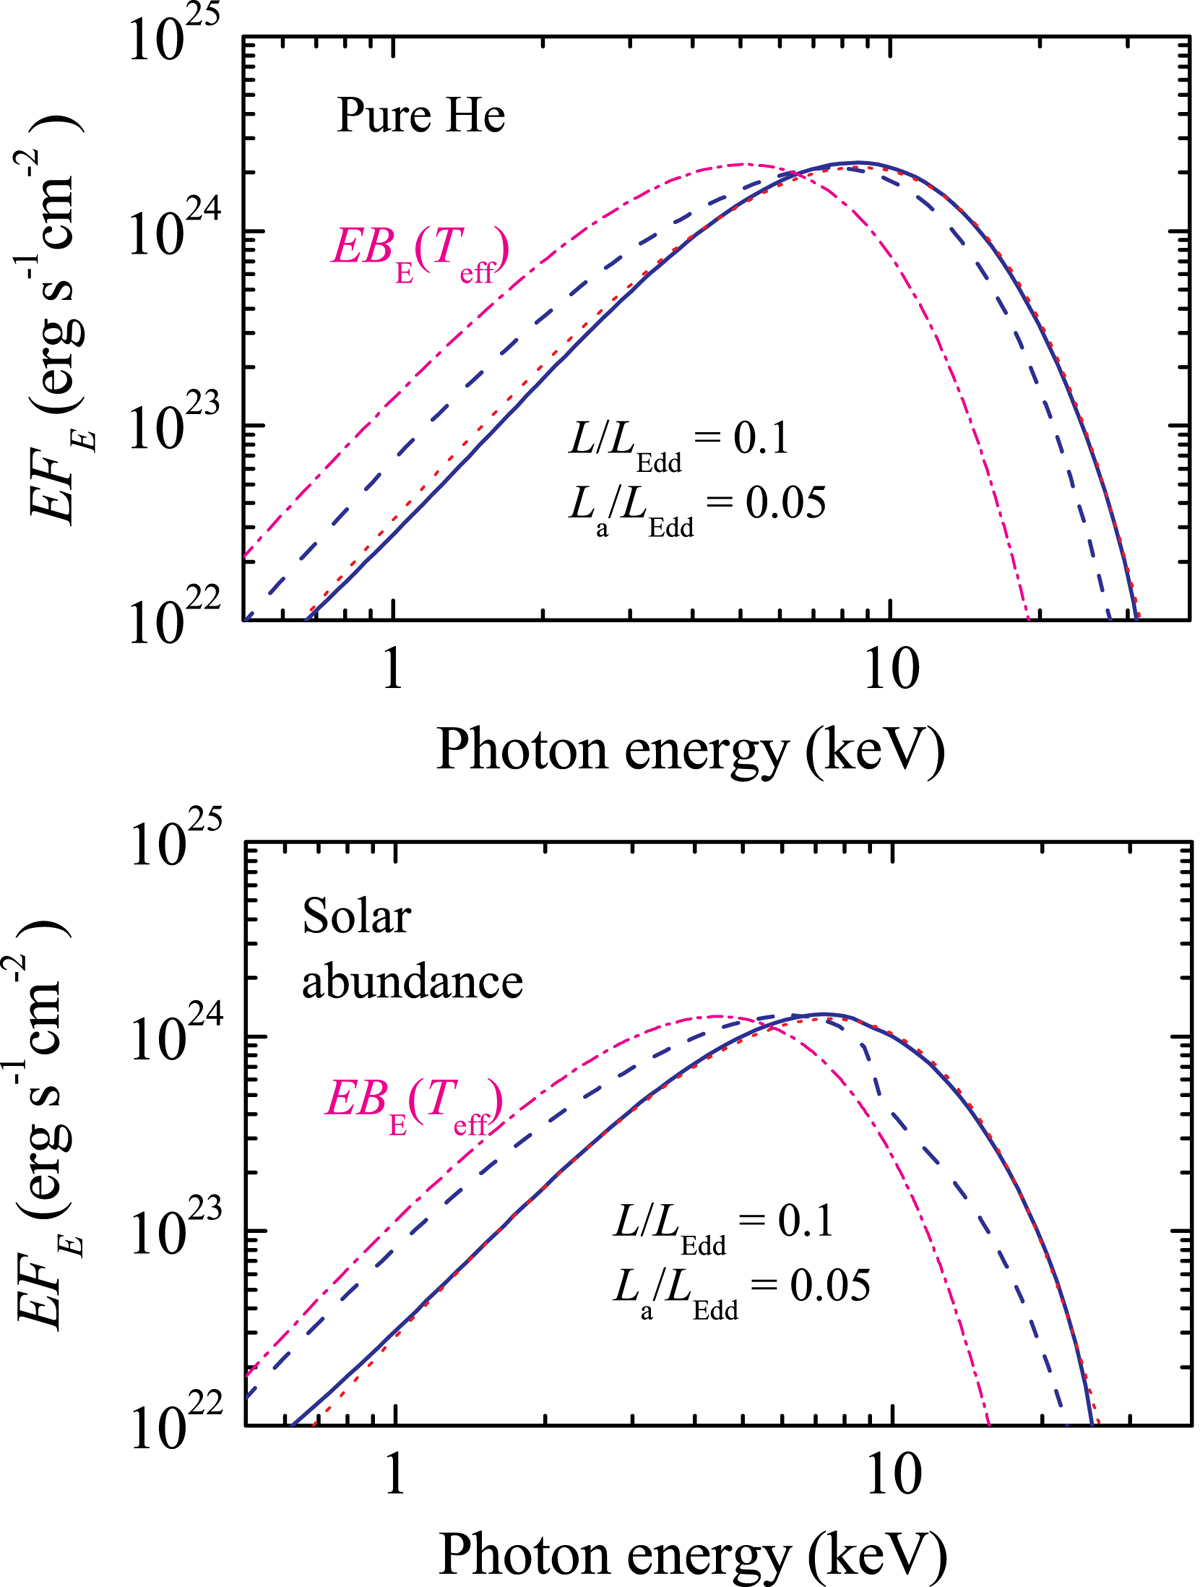
Residual spectra (solid curves) of the heated model atmospheres with parameters ℓ = 0.1, ℓa = 0.05, χ = 0.2, η = 0.75, and Ψ = 60° for two chemical compositions, pure helium (top panel) and solar abundance (bottom panel). The spectra of undisturbed atmospheres are shown by dashed curves. The best-fit diluted blackbody spectra to the residual spectra are shown by the dotted curves, and the blackbodies of the effective temperatures are shown by the pink dash-dotted curves.
Current usage metrics show cumulative count of Article Views (full-text article views including HTML views, PDF and ePub downloads, according to the available data) and Abstracts Views on Vision4Press platform.
Data correspond to usage on the plateform after 2015. The current usage metrics is available 48-96 hours after online publication and is updated daily on week days.
Initial download of the metrics may take a while.