Free Access
Fig. 2
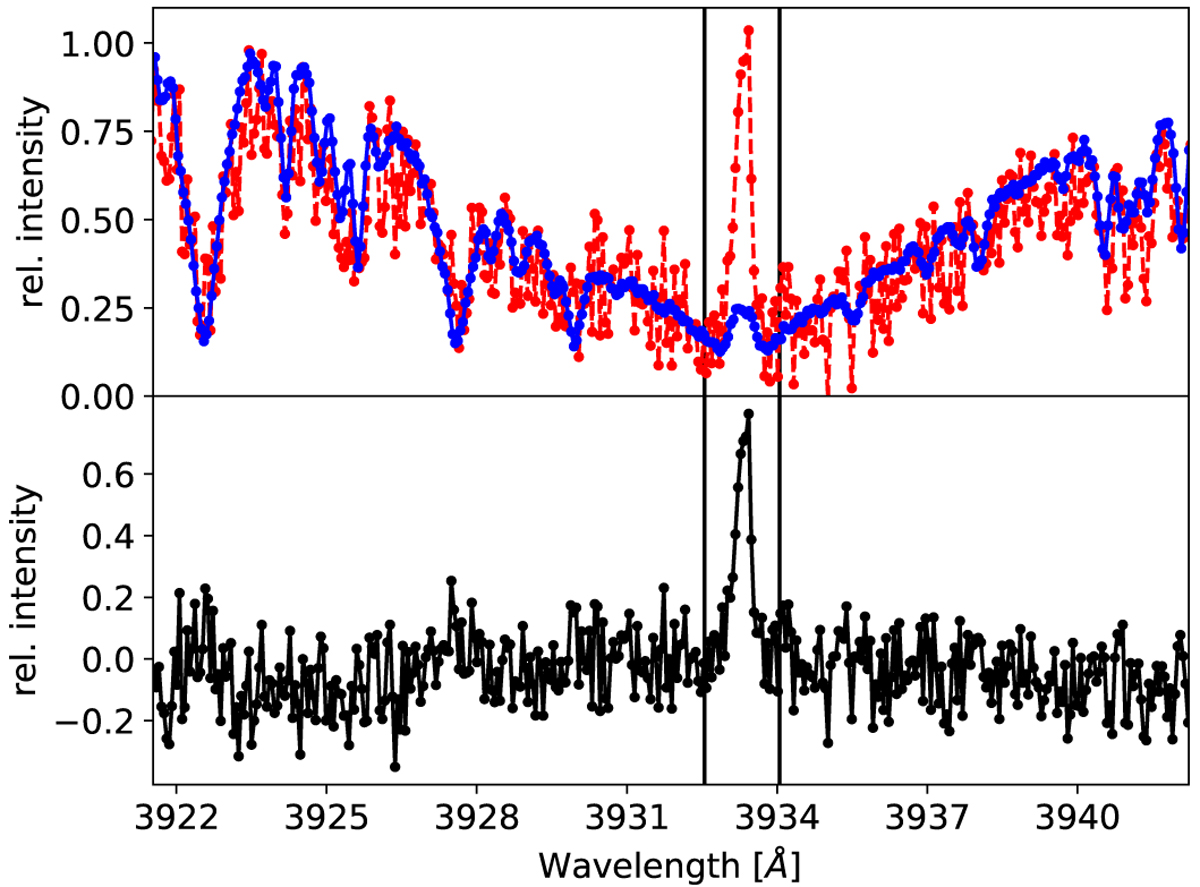
Upper panel: comparison of the Ca K line in HD 189733 (dashed red) and HD 10476 (solid blue). Lower panel: chromospheric excess spectrum of HD 189733 after the subtraction of HD 10476. The vertical lines denote our 1.5 Å integration band.
Current usage metrics show cumulative count of Article Views (full-text article views including HTML views, PDF and ePub downloads, according to the available data) and Abstracts Views on Vision4Press platform.
Data correspond to usage on the plateform after 2015. The current usage metrics is available 48-96 hours after online publication and is updated daily on week days.
Initial download of the metrics may take a while.