Fig. 1
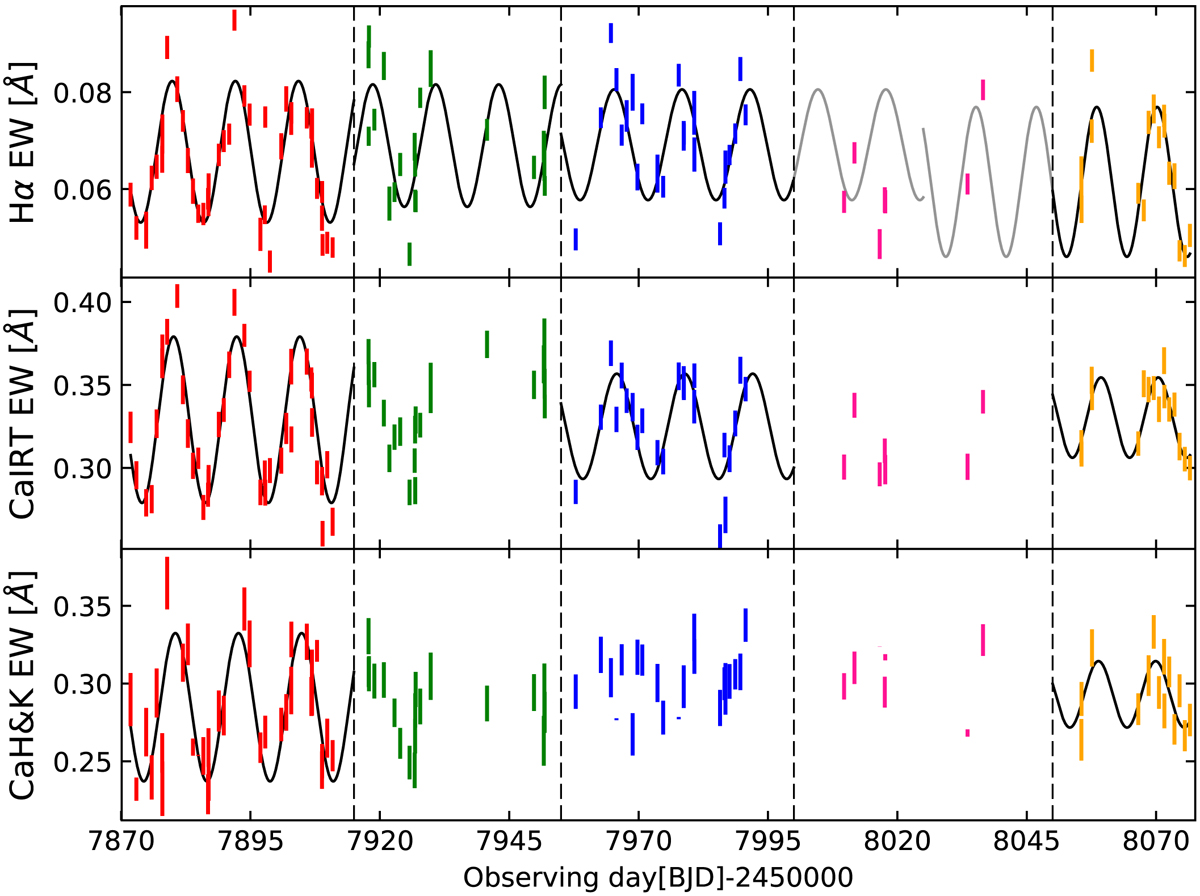
Hα, Ca IRT, and Ca H&K excess equivalent width versus time. The thin black lines are the maximum power sine waves derived from our periodogram analysis and thin gray lines represent extrapolations to emphasize phase jumps. Vertical dashed lines denote the different subsamples. If the rotation period of the best-fit solution deviates significantly from the literature value of 12 days, we do not plot it. In case of Ca H&K, we removed two outliers.
Current usage metrics show cumulative count of Article Views (full-text article views including HTML views, PDF and ePub downloads, according to the available data) and Abstracts Views on Vision4Press platform.
Data correspond to usage on the plateform after 2015. The current usage metrics is available 48-96 hours after online publication and is updated daily on week days.
Initial download of the metrics may take a while.