Fig. 8.
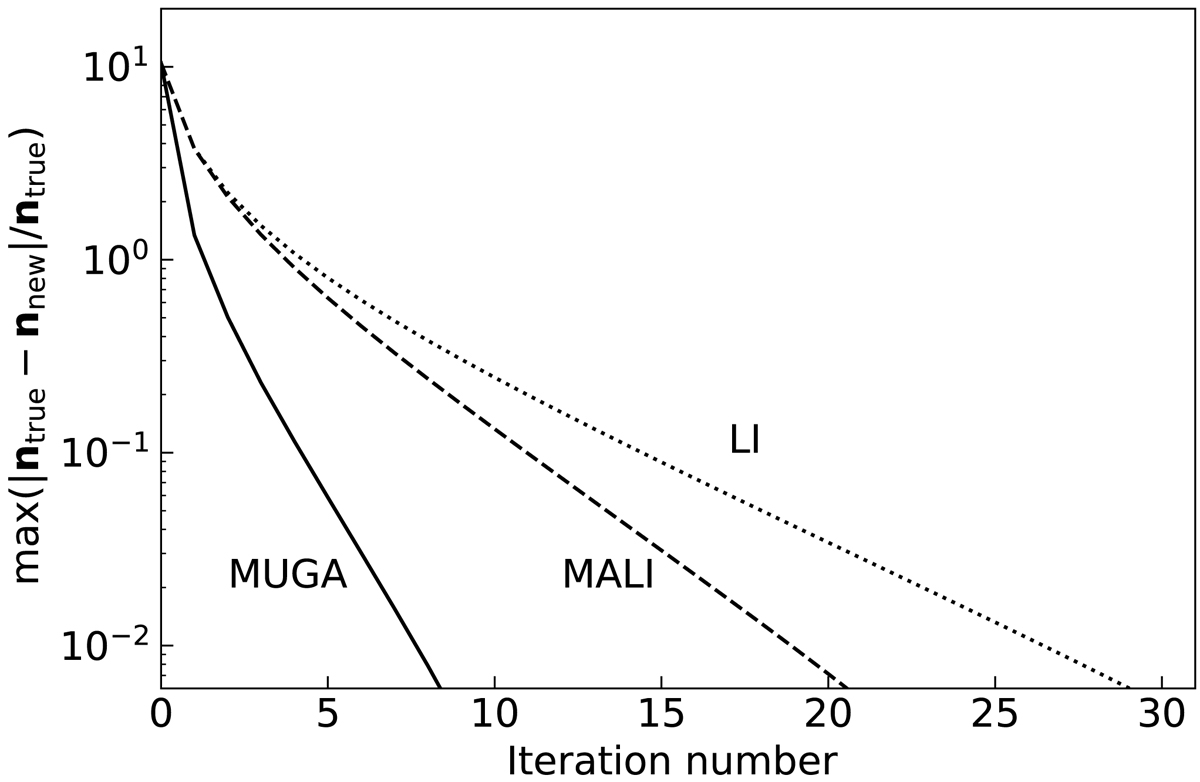
Convergence plots by different iteration methods, MUGA (solid line), MALI (dashed line), and LI (dotted line), for the seven-level H2O model of Ganymede’s atmosphere at SSL = 10o . The vertical axis shows the maximum values of the relative difference between populations at each iteration step and the population which solved the system.
Current usage metrics show cumulative count of Article Views (full-text article views including HTML views, PDF and ePub downloads, according to the available data) and Abstracts Views on Vision4Press platform.
Data correspond to usage on the plateform after 2015. The current usage metrics is available 48-96 hours after online publication and is updated daily on week days.
Initial download of the metrics may take a while.