Fig. 6.
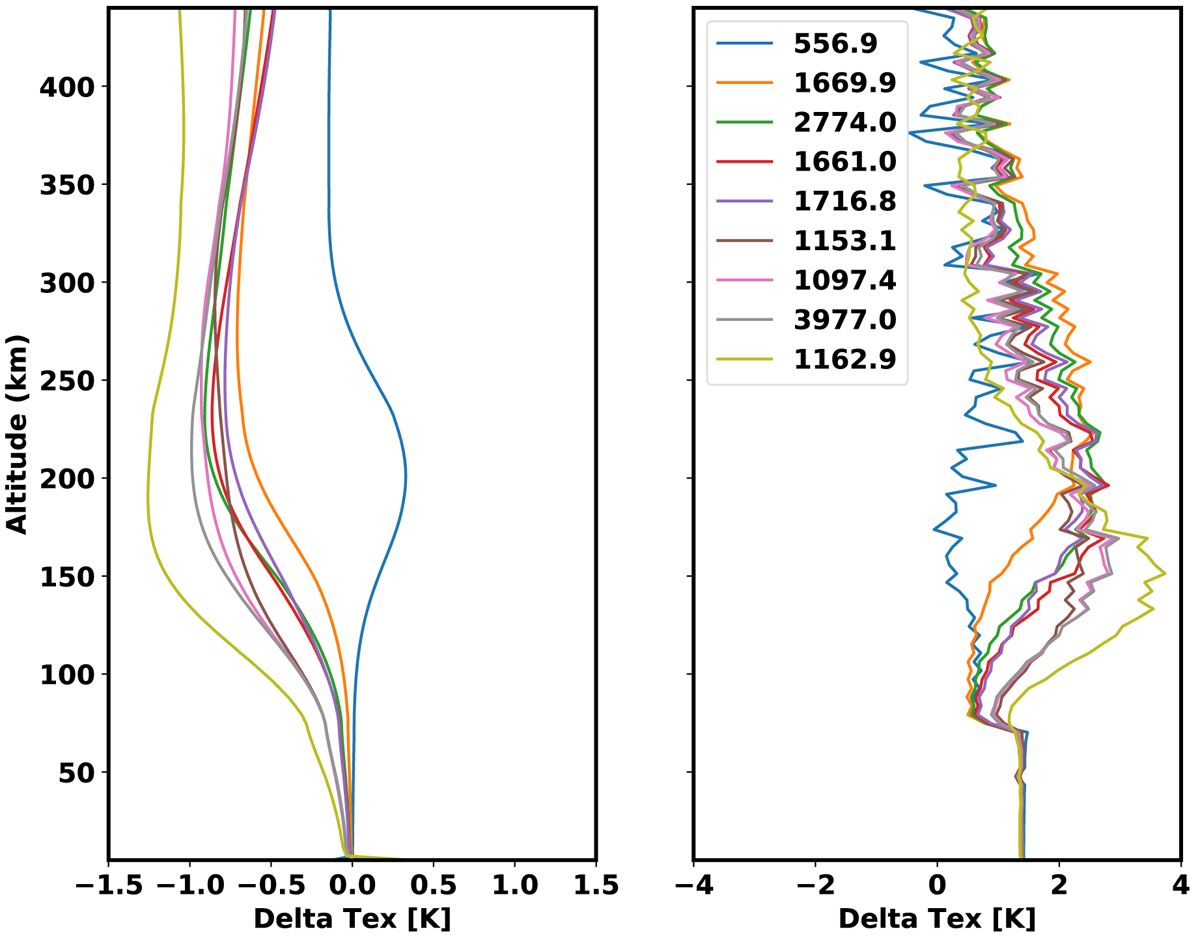
Left panel: profiles of absolute difference of the excitation temperatures calculated in this work (MUGA) and the MPS-ALI code and right panel: the same, but compared against calculations made by the RATRAN package. The atmospheric inputs correspond to the SSL = 10° conditions (see Fig. 4 for Tex magnitude). Lines of different colours correspond to the transitions as shown in the label in units of GHz.
Current usage metrics show cumulative count of Article Views (full-text article views including HTML views, PDF and ePub downloads, according to the available data) and Abstracts Views on Vision4Press platform.
Data correspond to usage on the plateform after 2015. The current usage metrics is available 48-96 hours after online publication and is updated daily on week days.
Initial download of the metrics may take a while.