Open Access
Fig. 10.
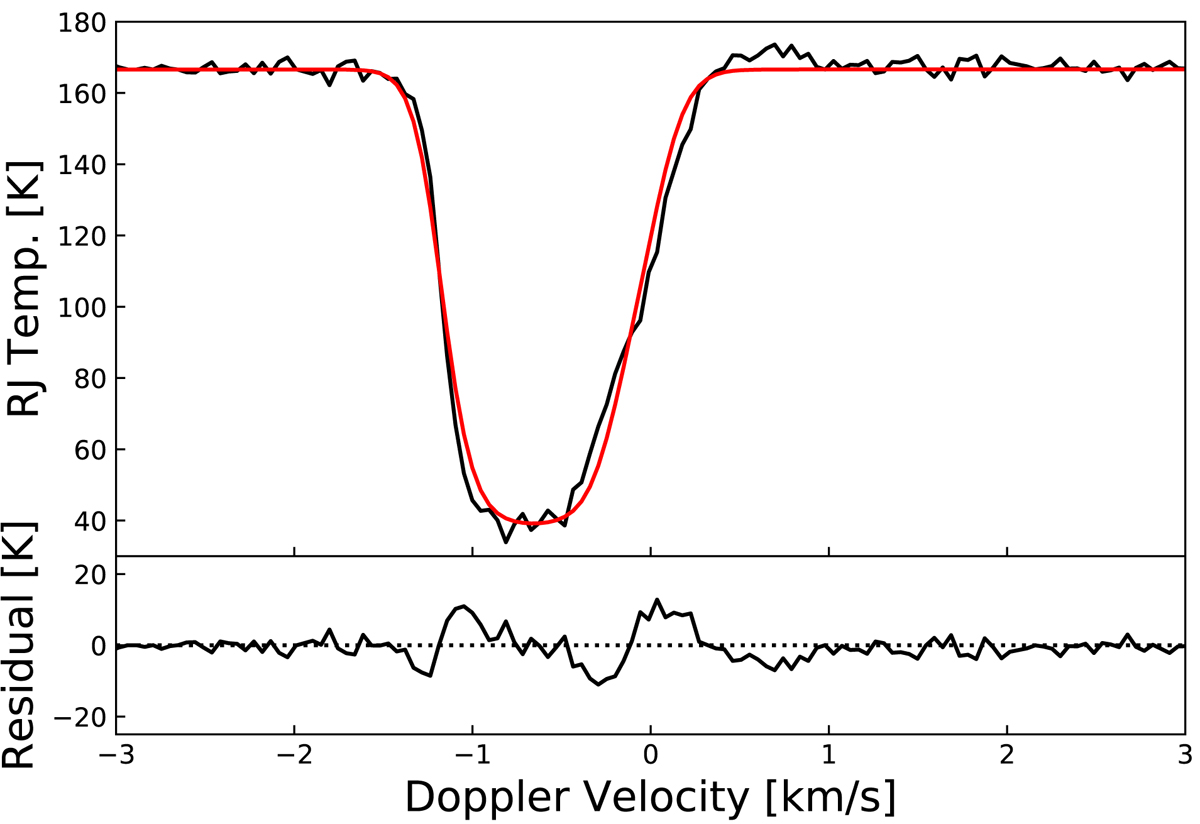
Top panel: comparison of the measurement (black line) and forward model (red line) spectra for the ortho-H2O (557 GHz) transition in nadir geometry (see text for details). Bottom panel: residual between the simulation and measurement spectra.
Current usage metrics show cumulative count of Article Views (full-text article views including HTML views, PDF and ePub downloads, according to the available data) and Abstracts Views on Vision4Press platform.
Data correspond to usage on the plateform after 2015. The current usage metrics is available 48-96 hours after online publication and is updated daily on week days.
Initial download of the metrics may take a while.