Table A.1
Line intensities from IRAM observations and production rates (upper limits are 3– σ).
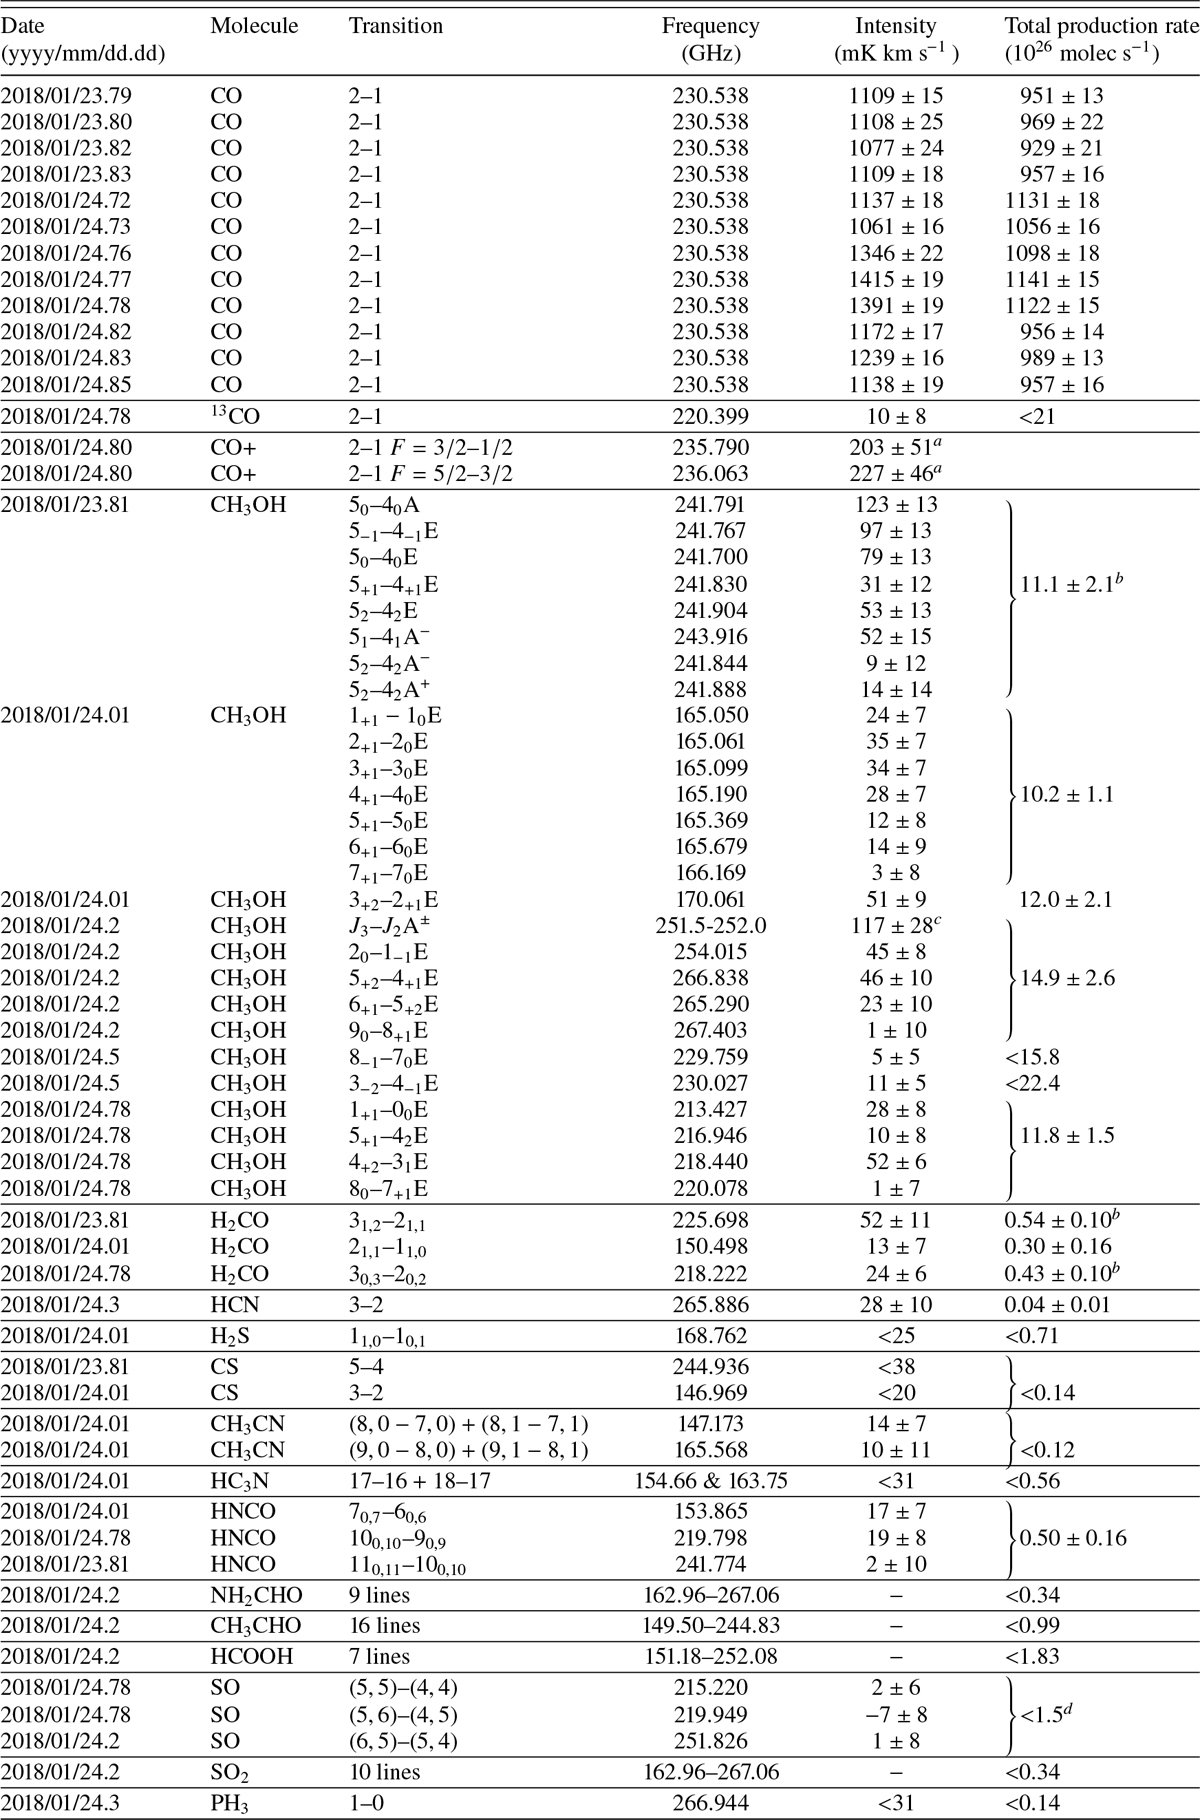 |
Notes. (a) The line integration window is −5 to +30 km s−1. (b) Average production rate for the period also taking into account measurements at 2–10′′ offsets (details in Table 5). For formaldehyde we assumed that all molecules come from the nucleus. (c) Sum of 12 lines (J = 3–8). (d) SO is assumed to come from the photo-dissociation of SO2 with a scale-length of 17 000 km (at rh = 2.8 AU).
Current usage metrics show cumulative count of Article Views (full-text article views including HTML views, PDF and ePub downloads, according to the available data) and Abstracts Views on Vision4Press platform.
Data correspond to usage on the plateform after 2015. The current usage metrics is available 48-96 hours after online publication and is updated daily on week days.
Initial download of the metrics may take a while.