Fig. 8
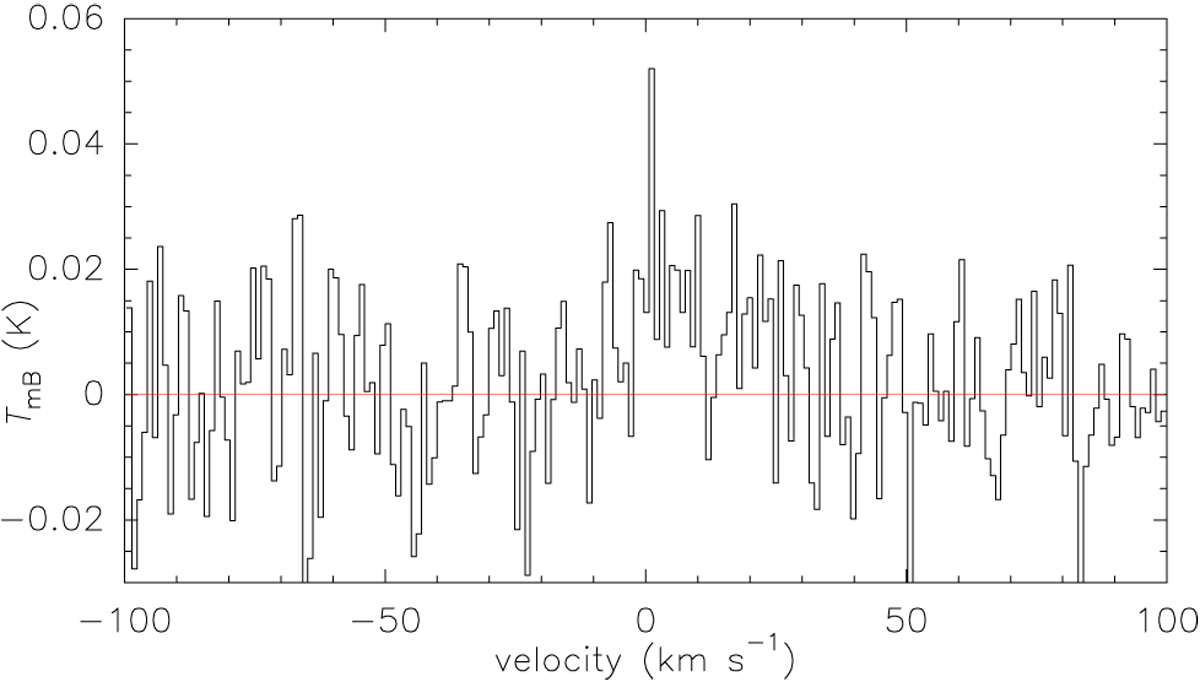
Weighted average of the two strongest CO+ N = 2 − 1 lines observed in C/2016 R2 (PanSTARRS) on 24.8 January 2018. Each line has been divided by its statistical weight (9/15 and 5/15 for the F = 5∕2 − 3∕2 and F = 3∕2 − 1∕2 transitions, respectively) before averaging. Scales are as in Fig. 3. The line shows a narrow peak close to the zero velocity and a broader component mostly red-shifted indicative of antisunward acceleration of CO+ ions by the solar wind.
Current usage metrics show cumulative count of Article Views (full-text article views including HTML views, PDF and ePub downloads, according to the available data) and Abstracts Views on Vision4Press platform.
Data correspond to usage on the plateform after 2015. The current usage metrics is available 48-96 hours after online publication and is updated daily on week days.
Initial download of the metrics may take a while.